CBOT Agricultural Commodities Analysis: Dollar Suppression Across the Board, Variety Divergence Intensifies, Who Has Regained Pricing Power for Grains?
2026-11-17 09:08:31
On Monday (November 16), the CBOT grain market showed a mixed picture. December corn settled at $4.487 per bushel, up 0.56%, rebounding from a four-month low hit the previous week; January soybeans settled at $12.29 per bushel, down 0.49%, despite record NOPA crush data; December wheat settled at $5.87 per bushel, down 0.97%, hovering near multi-month lows; December soybean meal settled at $334.60 per short ton, up 1.18%; soybean oil fell by about 2.5% along with crude oil. The strength of the US dollar is comprehensively suppressing the export competitiveness of US grains, and the differences between varieties depend on their respective funding structures and fundamentals. The US dollar index hit its highest level since April 2025, making US grains more expensive in the global market—wheat export sales fell to a low of 182,800 tons this year, while soybeans saw long positions liquidated by funds. Some analysts bluntly stated, "We are still struggling to secure export demand," even with a weak global spot market. Corn was the sole exception, its rise stemming from a technical rebound and export confirmation—the USDA confirmed the sale of 130,000 tons of corn to Colombia, and the domestic spot basis also strengthened as the harvest neared its end. Currently, CBOT grains are caught in a complex interplay of "dollar pressure" and "variety divergence." The bullish impact of the USDA report has been priced in, and market pricing power has returned to the dollar, exports, and funding structures. The core issue for soybeans is that "funds still hold over 100,000 net long positions"—making the market more sensitive to any negative news; the core issue for wheat is "weak export demand + competition from a bumper harvest in the Southern Hemisphere"; corn's rise is a combination of "technical rebound + export confirmation + strengthening basis."  As of 09:01 AM today (November 17th) in the Asian morning session, here is a summary of the price changes for related commodities.
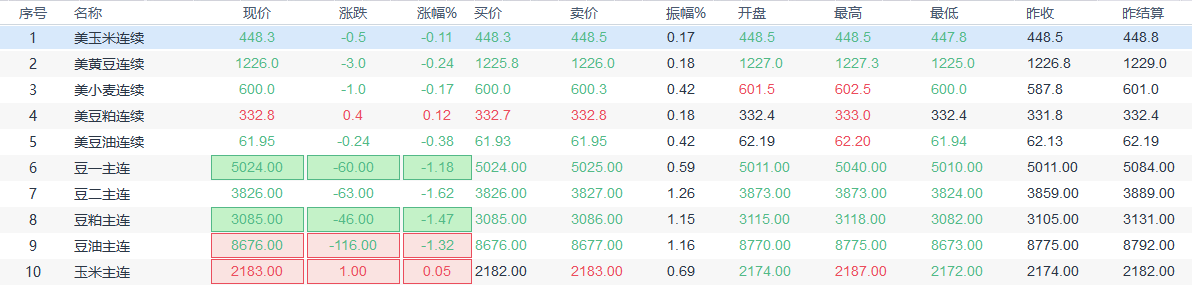 According to FX678's observations, estimates from overseas traders show that on Monday (November 16), the speculative positions of commodity funds on corn futures, soybean futures, wheat futures, soybean meal futures, and soybean oil futures at the Chicago Board of Trade (CBOT), namely the net positions and average net positions of CBOT commodity funds, are shown in the chart below created by FX678.
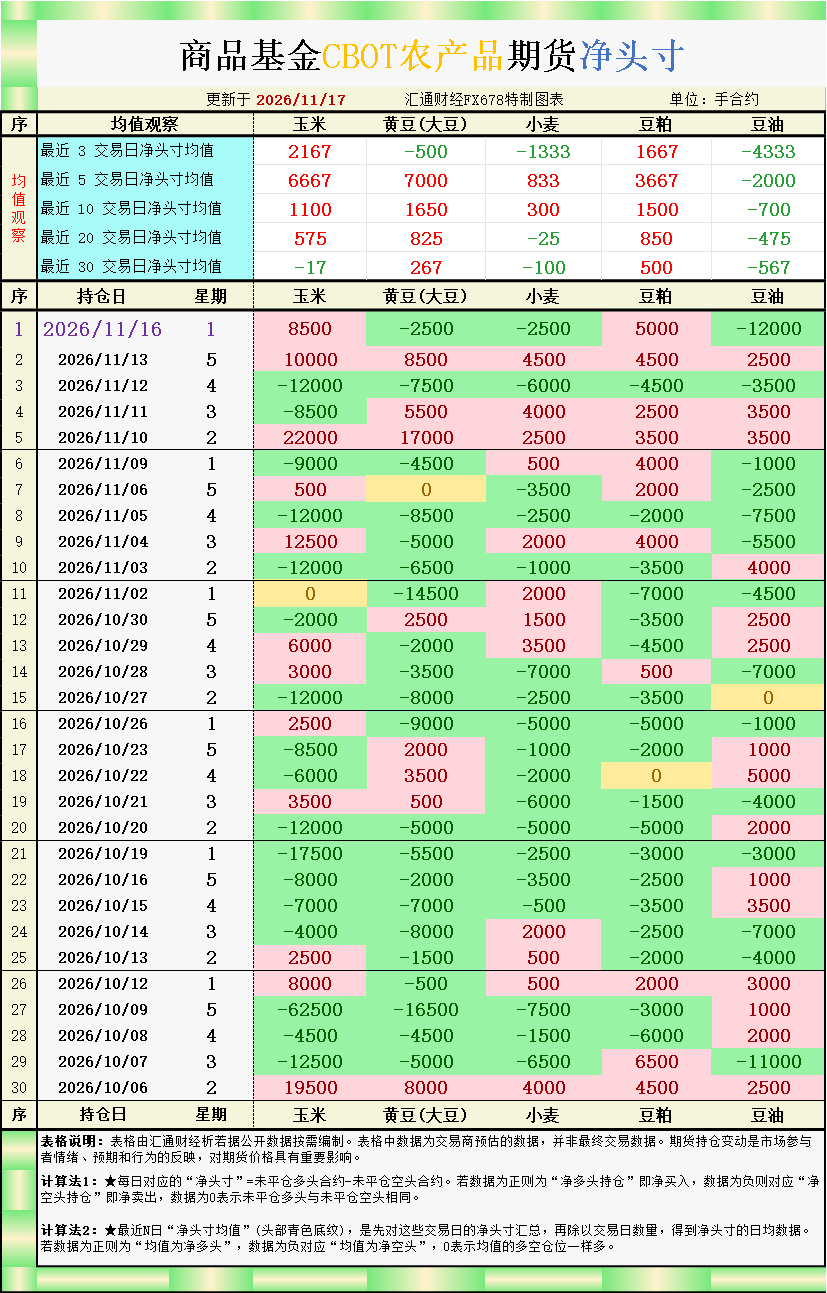 The following is an interpretation of the net positions and averages in the above position charts: [CBOT corn speculative positions: net buying of 8,500 contracts; average net buying of 2,167 contracts over the past 3 trading days; average net buying of 6,667 contracts over the past 5 trading days; average net buying of 1,100 contracts over the past 10 trading days; average net buying of 575 contracts over the past 20 trading days; average net selling of 17 contracts over the past 30 trading days.] [CBOT soybean speculative positions: net selling of 2,500 contracts; average net selling of 500 contracts over the past 3 trading days; average net buying of 7,000 contracts over the past 5 trading days; average net buying of 1,650 contracts over the past 10 trading days; average net buying of 825 contracts over the past 20 trading days; average net buying of 267 contracts over the past 30 trading days.] [CBOT wheat speculative positions are net selling of 2,500 contracts; the average net position over the past 3 trading days is net selling of 1,333 contracts; the average net position over the past 5 trading days is net buying of 833 contracts; the average net position over the past 10 trading days is net buying of 300 contracts; the average net position over the past 20 trading days is net selling of 25 contracts; and the average net position over the past 30 trading days is net selling of 100 contracts.] [CBOT soybean meal speculative positions are net buying of 5,000 contracts; the average net position over the past 3 trading days is net buying of 1,667 contracts; the average net position over the past 5 trading days is net buying of 3,667 contracts; the average net position over the past 10 trading days is net buying of 1,500 contracts; the average net position over the past 20 trading days is net buying of 850 contracts; and the average net position over the past 30 trading days is net buying of 500 contracts.] [CBOT soybean oil speculative positions are net short at 12,000 contracts; the average net position over the past 3 trading days is net short at 4,333 contracts; the average net position over the past 5 trading days is net short at 2,000 contracts; the average net position over the past 10 trading days is net short at 700 contracts; the average net position over the past 20 trading days is net short at 475 contracts; and the average net position over the past 30 trading days is net short at 567 contracts.] CBOT grain positions, basis, and international supply and demand reveal new market trends. Detailed analysis of each commodity is provided below.
As of 09:01 AM today (November 17th) in the Asian morning session, here is a summary of the price changes for related commodities. According to FX678's observations, estimates from overseas traders show that on Monday (November 16), the speculative positions of commodity funds on corn futures, soybean futures, wheat futures, soybean meal futures, and soybean oil futures at the Chicago Board of Trade (CBOT), namely the net positions and average net positions of CBOT commodity funds, are shown in the chart below created by FX678. The following is an interpretation of the net positions and averages in the above position charts: [CBOT corn speculative positions: net buying of 8,500 contracts; average net buying of 2,167 contracts over the past 3 trading days; average net buying of 6,667 contracts over the past 5 trading days; average net buying of 1,100 contracts over the past 10 trading days; average net buying of 575 contracts over the past 20 trading days; average net selling of 17 contracts over the past 30 trading days.] [CBOT soybean speculative positions: net selling of 2,500 contracts; average net selling of 500 contracts over the past 3 trading days; average net buying of 7,000 contracts over the past 5 trading days; average net buying of 1,650 contracts over the past 10 trading days; average net buying of 825 contracts over the past 20 trading days; average net buying of 267 contracts over the past 30 trading days.] [CBOT wheat speculative positions are net selling of 2,500 contracts; the average net position over the past 3 trading days is net selling of 1,333 contracts; the average net position over the past 5 trading days is net buying of 833 contracts; the average net position over the past 10 trading days is net buying of 300 contracts; the average net position over the past 20 trading days is net selling of 25 contracts; and the average net position over the past 30 trading days is net selling of 100 contracts.] [CBOT soybean meal speculative positions are net buying of 5,000 contracts; the average net position over the past 3 trading days is net buying of 1,667 contracts; the average net position over the past 5 trading days is net buying of 3,667 contracts; the average net position over the past 10 trading days is net buying of 1,500 contracts; the average net position over the past 20 trading days is net buying of 850 contracts; and the average net position over the past 30 trading days is net buying of 500 contracts.] [CBOT soybean oil speculative positions are net short at 12,000 contracts; the average net position over the past 3 trading days is net short at 4,333 contracts; the average net position over the past 5 trading days is net short at 2,000 contracts; the average net position over the past 10 trading days is net short at 700 contracts; the average net position over the past 20 trading days is net short at 475 contracts; and the average net position over the past 30 trading days is net short at 567 contracts.] CBOT grain positions, basis, and international supply and demand reveal new market trends. Detailed analysis of each commodity is provided below.Soybean oil: Net short positions reached 12,000 lots in a single day, six times higher than the 5-day average, dragged down by energy prices and influenced by centralized pricing.
Soybean oil saw the most dramatic changes in open interest among the five commodities on Monday. Commodity funds net sold 12,000 contracts, compared to a 5-day average of 2,000 contracts and a 10-day average of 700 contracts – a six-fold increase in selling pressure compared to short-term averages, indicating that fund selling was a concentrated reaction to the drag from the energy sector. Soybean oil fell about 2.5% along with crude oil, which fell more than 3% due to signs of a recovery in Middle Eastern supply. This transmission chain is clearly identifiable: Middle Eastern supply recovery → crude oil price decline → weakened biodiesel economics → decreased soybean oil demand expectations → concentrated fund selling. Record NOPA crushing exacerbated the pressure from the supply side – October crushing reached 234.191 million bushels, the highest monthly figure, and soybean oil inventories rebounded from a near 12-year low last month. The increase in supply and the drag from the energy sector created a double pressure. The net selling of 12,000 contracts by funds forms a logical closed loop with this double pressure, indicating that the soybean oil sell-off was driven by both fundamentals and the energy sector, rather than simply sentiment. In the short term, the weakness in soybean oil is unlikely to change, and a rebound would require stabilization of crude oil prices or a narrowing of crushing margins to trigger it.Soybeans: Net selling of 2,500 contracts, but the 5-day moving average is still showing net buying, indicating that selling pressure has just begun, not ended.
On Monday, commodity funds net sold 2,500 soybean contracts, compared to a 3-day average of 500 net sales and a 5-day average of 7,000 net purchases—a shift from long to short positions in a single day, but the magnitude was small, indicating that the selling pressure was "just beginning" rather than "over." The January contract closed at $12.29, down 2.5 cents, despite a record NOPA crush. The core factor suppressing the market was the long positions held by funds. One analyst bluntly stated, "We still have funds holding over 100,000 net long positions, so I think they are quietly exiting." The bullish impact of the record NOPA crush was overshadowed by this positioning behavior—when the market already holds a large number of long positions, any bearish news is amplified, while bullish news is used for "selling." In addition, the drag from the energy market was transmitted to soybeans through soybean oil, with crude oil falling by more than 3% and soybean oil falling by about 2.5%, putting spillover pressure on soybeans. In terms of basis, the Midwest soybean basis was generally stable to rising, with the US Gulf CIF soybean November shipment premium at 110 cents. Harvesting is 96% complete, above the average. The closing price was $12.29, with a target of $12.20. A rebound would require funds to stop liquidating their positions or export sales to exceed expectations. The contrast between net selling of 2,500 contracts and the 5-day average net buying of 7,000 contracts indicates that the sustainability of this selling pressure depends on whether funds continue to reduce their net long positions of over 100,000 contracts.Wheat: Net selling of 2,500 lots, driven by weak exports and competition from the Southern Hemisphere.
Wheat commodity funds net sold 2,500 contracts on Monday, higher than the 3-day average of 1,333 contracts – the consistent net selling direction indicates that funds' bearish stance on wheat continues. The December contract closed at $5.87, down 6.25 cents, hovering near multi-month lows. Three key factors weighed on the market: first, a stronger dollar, with the dollar index reaching its highest level since April 2025, making US grains less competitive; second, weak exports, with wheat export sales for the week ending November 5th at 182,800 tons, the lowest this year, with one analyst stating bluntly, "We are still struggling to secure export demand"; and third, competition from the Southern Hemisphere, with Australia and Argentina expected to harvest more than anticipated, injecting new supply in the coming months, with Argentina particularly offering lower prices. On the basis front, the basis for hard red winter wheat in the US Plains remained largely stable, with the winter wheat good-to-excellent rating rising to 53%, up from 49% a week earlier, and planting 92% complete – improved crop conditions easing drought concerns. Export inspections totaled 391,515 tons, exceeding trade expectations, but this contrasts with the "lowest export sales of the year," indicating that inspections reflect previously completed shipments, while new sales are a leading indicator. The closing price was $5.87, with a downside target of $5.80. A rebound would require a weaker dollar or supply issues in the Southern Hemisphere. Net selling of 2,500 contracts by funds echoes the assessment of weak exports, suggesting that short sellers have not yet withdrawn near multi-month lows.Corn: Net buying of 8,500 lots, continuing the trend of net buying; technical rebound and export confirmation of support.
Corn commodity funds saw net buying of 8,500 contracts on Monday, higher than the 3-day average of 2,167 contracts and the 5-day average of 6,667 contracts. This consistent net buying over several days indicates that fund purchases are gradual and sustained. The December contract closed at $4.487, up 3.25 cents, rebounding from a four-month low reached the previous week. Support came from three directions: firstly, a technical rebound – prices found support at the four-month low; secondly, export confirmation – the USDA confirmed the sale of 130,000 tons of corn to Colombia; and thirdly, a strengthening domestic basis – the domestic spot corn basis strengthened as the harvest neared completion. Harvesting is 88% complete, below average, as rainfall slowed progress in some areas – this detail reduced short-term supply pressure, providing support for the basis. The net fund buying of 8,500 contracts aligns with the assessment of a "technical rebound + export confirmation + strengthening basis." The closing price was $4.487, with a downside target of $4.40. The sustainability of the rebound depends on whether export sales can take over from technical buying. Despite a strengthening dollar, corn managed to close higher and attract net fund buying, indicating that the combination of a strengthening domestic basis and confirmed exports provides relative resilience.Soybean Meal: Net buying of 5,000 lots, continuing the trend of net buying, supported by record crushing and stable basis.
On Monday, commodity funds saw net buying of 5,000 contracts of soybean meal, higher than the 3-day average of 1,667 contracts and the 5-day average of 3,667 contracts—the consistent direction of net buying indicates that fund purchases are gradual. The December contract closed at $334.60, up $4.80. The cash basis held steady in thin trading as newly harvested soybeans entered the supply chain. Record NOPA crushing provided supply-side support for soybean meal—the record crushing indicates ample supply, but also reflects improved crushing margins and strong demand. In international trading, major South Korean feed groups purchased approximately 50,000 to 60,000 tons of soybean meal in private transactions, and the Feed Leaders Committee tendered for another 50,000 to 60,000 tons of soybean meal from selectable origins. The net fund purchase of 5,000 contracts echoes the assessment of record crushing and robust demand. The $334.60 level corresponds to the marginal pricing of new crop crushing supply, and the price is likely to fluctuate in the $330 to $340/short ton range in the short term. A stable basis provides support, but the loose supply situation limits the upside potential.Summary: Soybean oil saw concentrated selling pressure, soybeans experienced initial selling pressure, while corn and soybean meal saw continued buying.
A clear divergence is emerging based on the combined open interest data of the five major commodities: soybean oil saw net selling of 12,000 contracts (six times higher than the 5-day average), soybeans saw net selling of 2,500 contracts (the 5-day average is still showing net buying), and wheat saw net selling of 2,500 contracts, while corn saw net buying of 8,500 contracts and soybean meal saw net buying of 5,000 contracts. This divergence means that fund selling pressure is concentrated on commodities most directly affected by energy prices (soybean oil) and commodities with weak exports and competition from the Southern Hemisphere (wheat), while buying is concentrated on commodities with strengthening domestic basis and confirmed exports (corn) and commodities with stable crushing demand (soybean meal). The net selling of soybeans is just beginning—the 5-day average is still showing net buying of 7,000 contracts, indicating that the more than 100,000 net long positions are still slowly being cleared. The divergence between basis and futures is a consistent signal. The basis between soybeans and corn in the Midwest and West remains stable to rising, and the CIF premium in the US Gulf Coast remains stable to rising—domestic demand is absorbing supply. This situation implies that while domestic demand in the US is genuine, international buyers are adopting a wait-and-see approach or opting for South American supplies after the dollar strengthened. Looking ahead, three key indicators to watch for in terms of whether soybean oil can stabilize on the energy front, whether soybeans can find support above $12.20, and whether wheat can hold above $5.80 are crucial for assessing whether this round of portfolio adjustments is nearing its end. Key indicators for the next one to two weeks include: fund position adjustments (over 100,000 net long positions in soybeans are a significant concern; continued liquidation would extend downward pressure), the direction of the dollar (a dollar pullback could provide some relief for export demand), and Southern Hemisphere supply (bumper harvests in Australia and Argentina will limit the rebound in wheat prices). Given the overall dollar pressure, product differentiation, and the uncertainty surrounding fund positions, the short-term market direction is biased towards the downside. However, the continued net buying of corn and soybean meal suggests that products supported by domestic fundamentals are still attracting investment.- Risk Warning and Disclaimer
- The market involves risk, and trading may not be suitable for all investors. This article is for reference only and does not constitute personal investment advice, nor does it take into account certain users’ specific investment objectives, financial situation, or other needs. Any investment decisions made based on this information are at your own risk.