Crude oil trading alert: Supply expectations are suppressing oil prices; US crude oil has returned to previous lows; be wary of a break below support levels.
2026-11-17 09:40:32
The International Energy Agency (IEA) significantly revised its oil market balance forecast in a report last Friday, predicting that global crude oil supply will exceed demand by 1.7 million barrels per day in the fourth quarter of 2026, shifting from a previously anticipated supply shortage to a clear surplus. The core reasons are twofold: high oil prices have suppressed end-user demand, while Middle Eastern crude oil exports are gradually recovering, coupled with US crude oil production remaining near record levels, resulting in overall supply elasticity exceeding previous market estimates. Analysts at BOK Financial noted that while geopolitical tensions are gradually becoming normalized, overall crude oil supply remains stable, continuing to exert downward pressure on oil prices.  However, the shipping risks in the Strait of Hormuz have not dissipated. Iran reported that a fourth oil tanker in the restricted area on the eastern side of the Strait of Hormuz struck a mine and caught fire in the past 24 hours. The UK Maritime Trade and Investment Corporation (UKMTO) also confirmed the incident. The ongoing attacks on ships are pushing up tanker insurance and shipping costs. Rabobank offers a different medium- to long-term perspective: the oil market's contradictions lie not only in flow, but also in transportation costs and supply chain fragility. The surcharge for crude oil shipped to Asia remains close to $20 per barrel. Even with improved circulation, the continued depletion of inventory buffers will raise the floor for oil prices, and these disturbances will likely continue until at least the first half of 2027. The focus today is on the US API crude oil inventory data. A significant increase in inventories will further reinforce the oversupply logic and put downward pressure on oil prices; a substantial decrease in inventories could lead to a short-term rebound. EIA official inventory data will also be released later, and we will continue to monitor shipping safety news in the Strait of Hormuz. On the daily chart, WTI continues its corrective trend, with prices steadily trading below the 100-day moving average and the 20-day Bollinger Band middle line. The dense supply area above provides significant resistance, and the short-term bearish tone remains unchanged. The 14-period RSI has fallen back to around 35, approaching oversold territory, indicating that bearish momentum is still being released but shows signs of gradual exhaustion, and a short-term low-level consolidation cannot be ruled out. On the downside, the first support level is the lower Bollinger Band at 79.70, a key support level for this round of decline; if this level is breached, further downside potential will open up. The first resistance level is the 100-day moving average at 87.30, followed by the Bollinger Band middle line at 93.20; only if the price holds above this set of resistances can the current bearish structure be reversed, with a further target of the upper Bollinger Band at 106.65. On the 4-hour chart, the moving averages are in a bearish alignment, and rebounds are likely to be suppressed by the moving averages, maintaining a short-term downward trend. Sudden geopolitical events could trigger rapid, impulsive rebounds, further increasing volatility; be wary of the risk of false breakouts based on news.
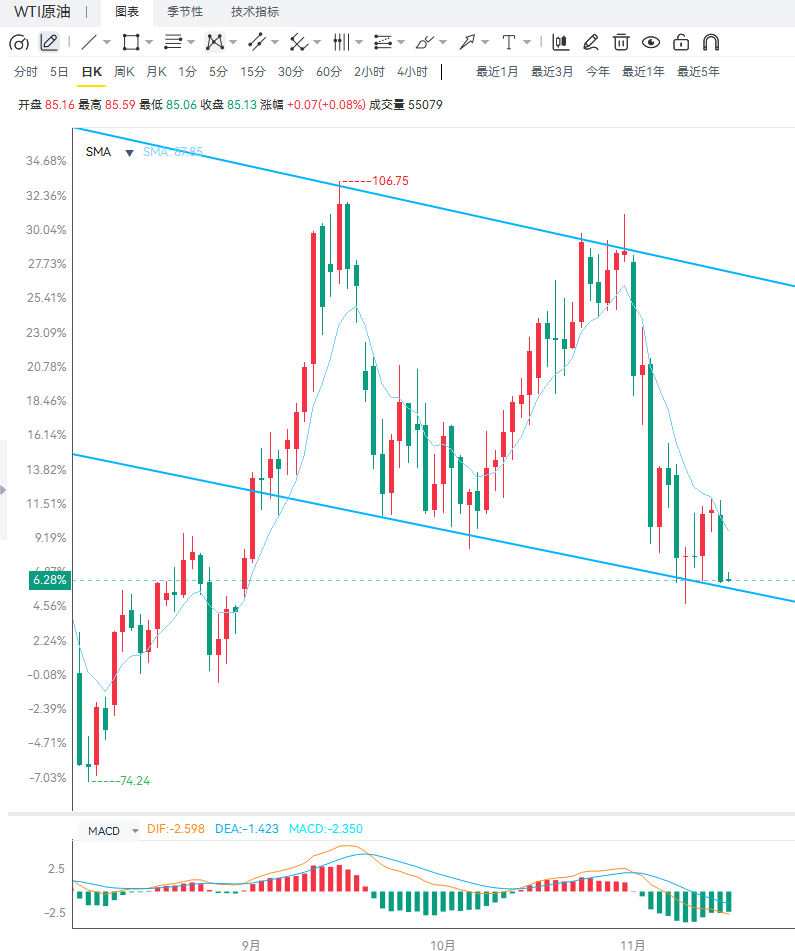 Editor's Summary: The core factor driving current oil prices is the conflict between the IEA's fourth-quarter supply glut forecast and the ongoing shipping risks and high transportation costs in the Strait of Hormuz. Supply glut is the main factor suppressing prices, while geopolitical factors only provide temporary support and are unlikely to reverse the current downtrend. Technical indicators are approaching oversold levels, suggesting caution regarding a short-term rebound after the oversold condition, but the trend remains bearish until prices stabilize above 87.30. Closely monitor API inventory data and the latest geopolitical developments today.
However, the shipping risks in the Strait of Hormuz have not dissipated. Iran reported that a fourth oil tanker in the restricted area on the eastern side of the Strait of Hormuz struck a mine and caught fire in the past 24 hours. The UK Maritime Trade and Investment Corporation (UKMTO) also confirmed the incident. The ongoing attacks on ships are pushing up tanker insurance and shipping costs. Rabobank offers a different medium- to long-term perspective: the oil market's contradictions lie not only in flow, but also in transportation costs and supply chain fragility. The surcharge for crude oil shipped to Asia remains close to $20 per barrel. Even with improved circulation, the continued depletion of inventory buffers will raise the floor for oil prices, and these disturbances will likely continue until at least the first half of 2027. The focus today is on the US API crude oil inventory data. A significant increase in inventories will further reinforce the oversupply logic and put downward pressure on oil prices; a substantial decrease in inventories could lead to a short-term rebound. EIA official inventory data will also be released later, and we will continue to monitor shipping safety news in the Strait of Hormuz. On the daily chart, WTI continues its corrective trend, with prices steadily trading below the 100-day moving average and the 20-day Bollinger Band middle line. The dense supply area above provides significant resistance, and the short-term bearish tone remains unchanged. The 14-period RSI has fallen back to around 35, approaching oversold territory, indicating that bearish momentum is still being released but shows signs of gradual exhaustion, and a short-term low-level consolidation cannot be ruled out. On the downside, the first support level is the lower Bollinger Band at 79.70, a key support level for this round of decline; if this level is breached, further downside potential will open up. The first resistance level is the 100-day moving average at 87.30, followed by the Bollinger Band middle line at 93.20; only if the price holds above this set of resistances can the current bearish structure be reversed, with a further target of the upper Bollinger Band at 106.65. On the 4-hour chart, the moving averages are in a bearish alignment, and rebounds are likely to be suppressed by the moving averages, maintaining a short-term downward trend. Sudden geopolitical events could trigger rapid, impulsive rebounds, further increasing volatility; be wary of the risk of false breakouts based on news. Editor's Summary: The core factor driving current oil prices is the conflict between the IEA's fourth-quarter supply glut forecast and the ongoing shipping risks and high transportation costs in the Strait of Hormuz. Supply glut is the main factor suppressing prices, while geopolitical factors only provide temporary support and are unlikely to reverse the current downtrend. Technical indicators are approaching oversold levels, suggesting caution regarding a short-term rebound after the oversold condition, but the trend remains bearish until prices stabilize above 87.30. Closely monitor API inventory data and the latest geopolitical developments today.
- Risk Warning and Disclaimer
- The market involves risk, and trading may not be suitable for all investors. This article is for reference only and does not constitute personal investment advice, nor does it take into account certain users’ specific investment objectives, financial situation, or other needs. Any investment decisions made based on this information are at your own risk.