Analysts: Gold prices are under short-term pressure due to selling pressure on US Treasuries and tech stocks; the bursting of the AI bubble will subsequently benefit gold.
2026-11-17 10:42:30
Independent precious metals analyst Jesse Colombo, founder of BubbleBubbleReport, argues that while gold is currently facing pressure from both rising US Treasury yields and a concentrated sell-off in the technology sector, the fundamentals of gold's long-term bull market remain unshaken. He believes that once the AI bubble bursts, a large influx of funds will flow into the precious metals market, providing new upward momentum for gold prices. Colombo is currently monitoring US Treasury yield trends, awaiting the opportune moment to establish a long position in gold.
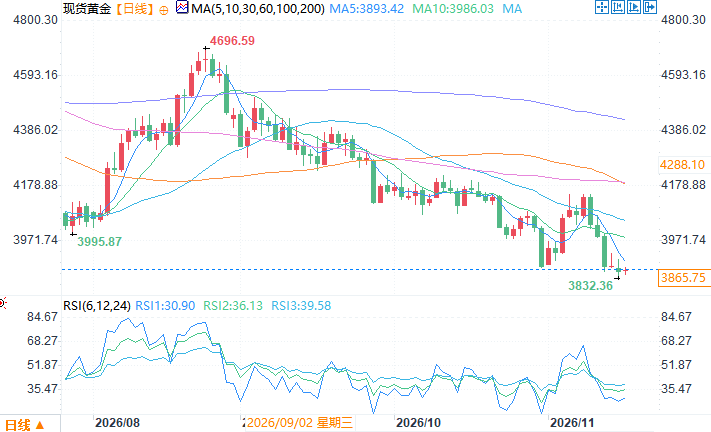 Spot gold daily chart source: FX678. At 10:41 AM Beijing time on November 17th, spot gold was trading at $3866.75 per ounce.
The short-term negative factors are clear, stemming from the surge in US Treasury yields coupled with forced liquidation of technology stocks.
Colombo noted that the 10-year US Treasury yield surged from 4.8% to 5.2% in just a few days, a rapid increase that almost erased most of the decline in October's yield. Rising real interest rates are the core factor suppressing gold prices. Meanwhile, the decline in the technology sector has had a ripple effect, forcing many investors to sell gold to offset losses on their tech positions, further amplifying the downward pressure on gold prices. In the early stages of the bursting valuation bubble in AI stocks, this passive selling across asset classes will continue to drag down gold prices, making it difficult to quickly reverse the current short-term downward pressure.Historical patterns: A bursting bubble leads to an initial decline followed by a rise; capital rotation benefits the long-term gold market.
Colombo compares the current AI boom to the early dot-com bubble, explaining that gold often weakens in the early stages of a bubble's collapse. However, as monetary policy shifts towards interest rate cuts, funds continue to flow into precious metals, initiating a long-term bull market. He points out that the long-term gold bull market that began in 2002 started precisely after the dot-com bubble burst. He believes the eventual bursting of the AI bubble will replicate a similar logic of capital migration, with large amounts of capital flowing out of overvalued technology sectors and instead allocating to safe-haven assets like gold. This is a key driver supporting the long-term bull market in precious metals.This pullback is a normal correction within a bull market, and the long-term trend structure remains intact.
In his view, every long-term bull market in precious metals is followed by a deep correction. Gold experienced a 50% pullback in the 1970s and a 34% drop in 2008, after which prices rebounded several times over. This current decline in gold prices, from its January high of about one-third, is similar in magnitude to the 2008 correction, but hasn't reached the depth of the 1970s adjustment. Colombo added that this decline essentially only erases the rapid surge of November and December of last year and January of this year, without disrupting the overall upward structure; the 60% correction in silver follows the same logic.Long-term moving average signals corroborate trends; an investment perspective needs to be taken a longer-term view.
Colombo used the 100-day moving average chart for spot gold to illustrate his point. This moving average filters out the interference from short-term sharp rises and falls, making it easier for investors to see the long-term trend. Data shows that the moving average has only flattened slightly in the past six months, maintaining a strong upward trend overall, confirming that the medium-term upward trend has not been broken. He reminded precious metal investors that they should not be limited to short-term price fluctuations of a few weeks or months. Gold allocation should be considered from a five-year or even ten-year perspective to grasp the main theme of this long-term bull market.Conclusion
Selling pressure from short-term US Treasury bonds and tech stocks will continue to weigh on gold prices, but this correction is a temporary adjustment within a bull market. The evolution of the AI bubble and a shift in the Federal Reserve's monetary policy will be the key catalysts for the next major upward trend in gold prices. Spot gold daily chart source: FX678. At 10:41 AM Beijing time on November 17th, spot gold was trading at $3866.75 per ounce.
- Risk Warning and Disclaimer
- The market involves risk, and trading may not be suitable for all investors. This article is for reference only and does not constitute personal investment advice, nor does it take into account certain users’ specific investment objectives, financial situation, or other needs. Any investment decisions made based on this information are at your own risk.