Spot gold hit a more than one-year low and is testing its long-term value range.
2026-11-17 18:56:30
Gold prices rose slightly during the European session on Tuesday (November 17), as bears took a temporary breather. However, the previous trading day saw gold prices continue their decline, hitting a new low in over a year. The core driver of this sell-off was a stronger dollar and high market expectations that the Federal Reserve would raise interest rates next month.  The US dollar index retreated in early trading on Tuesday, which may have been the reason for the stabilization of spot gold. However, the current rebound in the dollar still has room to continue: if the bulls can establish support at 103.540, the first upside target is 104.683, at which point gold prices will face further pressure. If the dollar index effectively breaks below 103.540, gold is expected to see a rebound driven by short covering. Last year, the market expected the Federal Reserve to cut interest rates 2 to 3 times in 2026, and spot gold surged all the way up, breaking historical records, driven by this expectation. This year, the situation has completely reversed: the market is now almost pricing in a Fed rate hike in December. For gold traders, the risk lies in uncertainty—how many more rate hikes the Fed will need to raise, and how long the high-interest-rate environment will be maintained to bring inflation back to the desired range. This may be the fundamental reason why the upside potential of gold prices is likely to be limited in the coming months. Weekly Technical Analysis After a sharp drop in gold prices on Monday, gold prices continued to decline overall this week. However, gold prices rebounded slightly from yesterday's low of $3,832.46, showing some signs of stabilization.
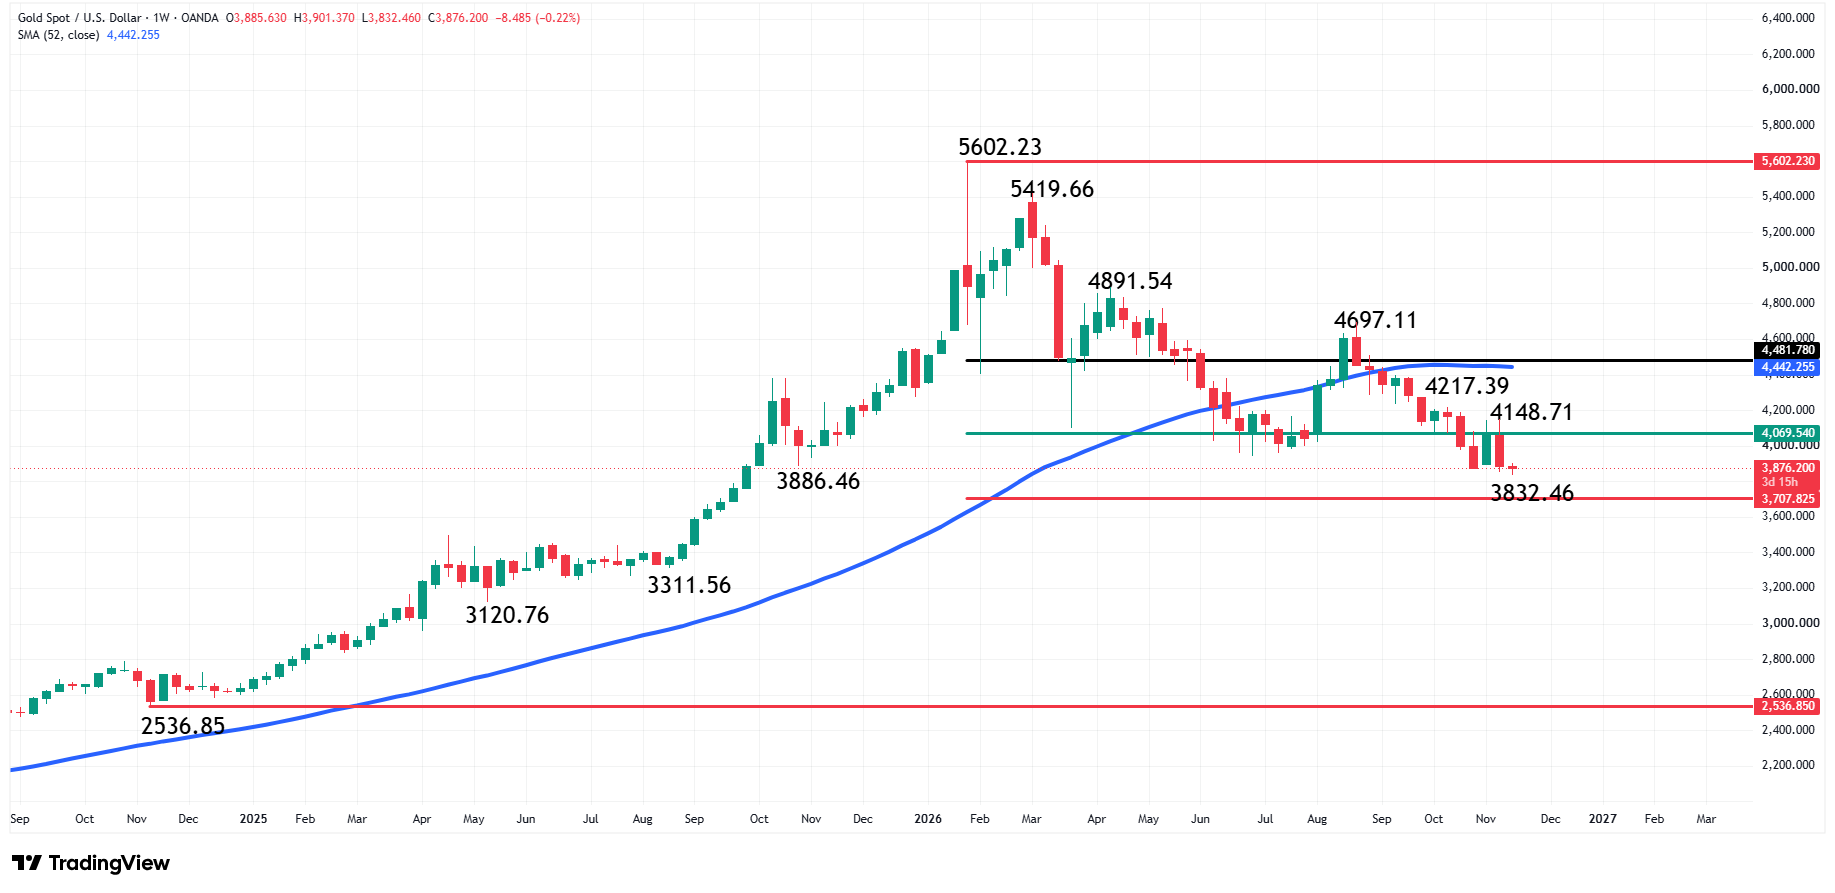 From the weekly chart, the current main trend is downward. If the price breaks through the key high of $4148.71, the main trend will reverse to upward; if it falls below $3832.46 again, it means the downtrend has resumed. This article defines the long-term trading range as $2536.85 to $5602.23. $2536.85 is an important bottom in November 2024, which will be used as a benchmark to calculate the upward trend of gold prices to the historical high in January 2026. The retracement range derived from this range is $4069.54-$3707.82, and spot gold is currently trading within this range. Some traders see this as a valuable investment opportunity; however, others believe that this range is merely a transitional zone for further downward movement in gold prices. From a bullish perspective, the price consolidation area formed by the 52-week moving averages of $4442.28 and $4481.78 is a core resistance level that long-term bulls must overcome. The price of $4481.78 represents a 20% drop from the historical high of $5602.23, a level traditionally considered the starting point of a bear market by technical analysts. In the author's framework, holding above this level is a crucial signal for the start of a new bull market. Based on this week's low of $3832.46, a 20% rise would correspond to $4598.95, traditionally considered the starting point for a new bull market. Additional calculation for reference: $3734.82 is a key observation level. A 20% rise from that level would reach $4481.78. If the bottom of this round falls above $3734.82, then the 20% retracement level will be higher than $4481.78; if the bottom falls below $3734.82, then the corresponding 20% rebound target will be lower than $4481.78. (Daily technical analysis)
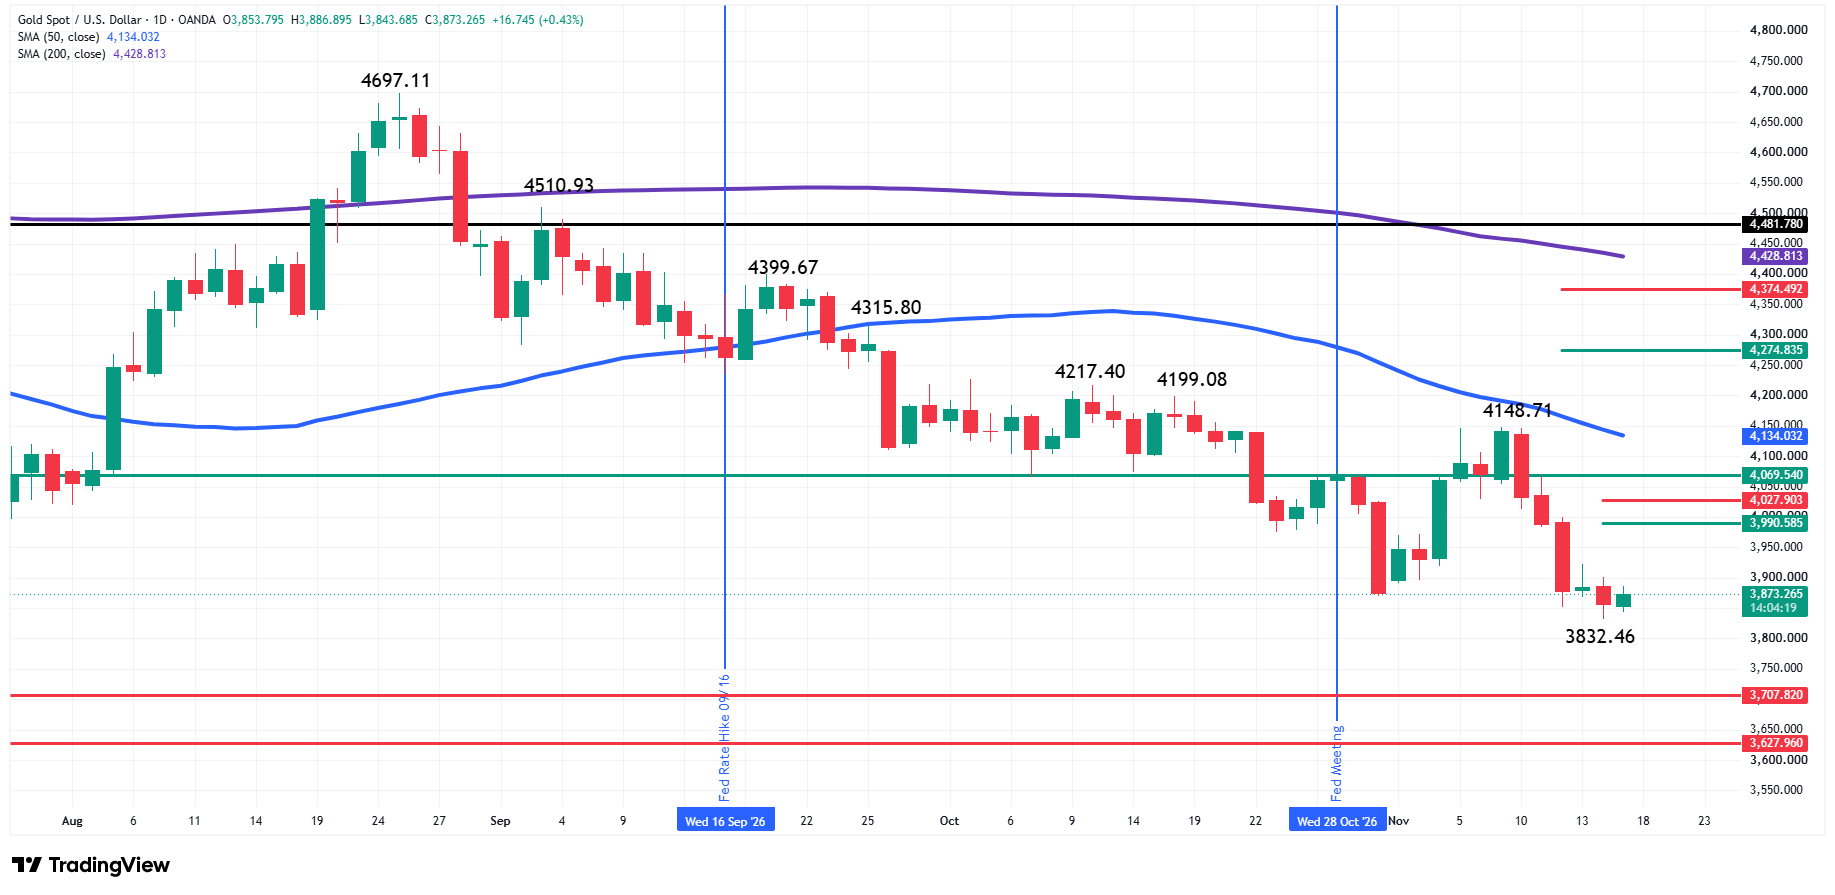 The daily chart shows a downward trend. A break below $3832.46 would confirm a resumption of the downtrend, with the next key target being the 61.8% Fibonacci retracement level at $3707.82, followed by the long-term bottom at $3627.96. A break above the previous swing high of $4148.71 would signal an upward trend. Crucially, this breakout would simultaneously hold above the 50% Fibonacci retracement level at $4069.54 and the 50-day moving average at $4134.03, likely indicating a substantial shift in momentum. Key signals to watch : The weekly chart also leans bearish: the main trend is downward, and gold prices are significantly below the 52-week moving average, indicating an overall bearish market. Current funds are trading within the long-term retracement range of $4069.54-$3707.82, seeking value opportunities. If gold prices fall below $3707.82, the bearish logic will be further strengthened; a firm hold above $4069.54 would be the first warning signal that the bearish pattern is beginning to loosen; a valid break above the swing high of $4148.71 would shift the view to bullish. From a daily chart perspective, the view is bearish: the main trend is downward, and gold prices are on the bearish side below the long-term 50% retracement level of $4069.54 and the 50-day moving average of $4134.03. If gold prices quickly break below $3832.46, the bearish expectation will strengthen, with the primary target at $3707.82. If the bulls recover the short-term 61.8% retracement level of $4027.90, the bearish expectation will weaken, and gold prices will have the opportunity to challenge the long-term 50% retracement level of $4069.54, the 50-day moving average of $4134.03, and the key high of $4148.71.
The US dollar index retreated in early trading on Tuesday, which may have been the reason for the stabilization of spot gold. However, the current rebound in the dollar still has room to continue: if the bulls can establish support at 103.540, the first upside target is 104.683, at which point gold prices will face further pressure. If the dollar index effectively breaks below 103.540, gold is expected to see a rebound driven by short covering. Last year, the market expected the Federal Reserve to cut interest rates 2 to 3 times in 2026, and spot gold surged all the way up, breaking historical records, driven by this expectation. This year, the situation has completely reversed: the market is now almost pricing in a Fed rate hike in December. For gold traders, the risk lies in uncertainty—how many more rate hikes the Fed will need to raise, and how long the high-interest-rate environment will be maintained to bring inflation back to the desired range. This may be the fundamental reason why the upside potential of gold prices is likely to be limited in the coming months. Weekly Technical Analysis After a sharp drop in gold prices on Monday, gold prices continued to decline overall this week. However, gold prices rebounded slightly from yesterday's low of $3,832.46, showing some signs of stabilization. From the weekly chart, the current main trend is downward. If the price breaks through the key high of $4148.71, the main trend will reverse to upward; if it falls below $3832.46 again, it means the downtrend has resumed. This article defines the long-term trading range as $2536.85 to $5602.23. $2536.85 is an important bottom in November 2024, which will be used as a benchmark to calculate the upward trend of gold prices to the historical high in January 2026. The retracement range derived from this range is $4069.54-$3707.82, and spot gold is currently trading within this range. Some traders see this as a valuable investment opportunity; however, others believe that this range is merely a transitional zone for further downward movement in gold prices. From a bullish perspective, the price consolidation area formed by the 52-week moving averages of $4442.28 and $4481.78 is a core resistance level that long-term bulls must overcome. The price of $4481.78 represents a 20% drop from the historical high of $5602.23, a level traditionally considered the starting point of a bear market by technical analysts. In the author's framework, holding above this level is a crucial signal for the start of a new bull market. Based on this week's low of $3832.46, a 20% rise would correspond to $4598.95, traditionally considered the starting point for a new bull market. Additional calculation for reference: $3734.82 is a key observation level. A 20% rise from that level would reach $4481.78. If the bottom of this round falls above $3734.82, then the 20% retracement level will be higher than $4481.78; if the bottom falls below $3734.82, then the corresponding 20% rebound target will be lower than $4481.78. (Daily technical analysis) The daily chart shows a downward trend. A break below $3832.46 would confirm a resumption of the downtrend, with the next key target being the 61.8% Fibonacci retracement level at $3707.82, followed by the long-term bottom at $3627.96. A break above the previous swing high of $4148.71 would signal an upward trend. Crucially, this breakout would simultaneously hold above the 50% Fibonacci retracement level at $4069.54 and the 50-day moving average at $4134.03, likely indicating a substantial shift in momentum. Key signals to watch : The weekly chart also leans bearish: the main trend is downward, and gold prices are significantly below the 52-week moving average, indicating an overall bearish market. Current funds are trading within the long-term retracement range of $4069.54-$3707.82, seeking value opportunities. If gold prices fall below $3707.82, the bearish logic will be further strengthened; a firm hold above $4069.54 would be the first warning signal that the bearish pattern is beginning to loosen; a valid break above the swing high of $4148.71 would shift the view to bullish. From a daily chart perspective, the view is bearish: the main trend is downward, and gold prices are on the bearish side below the long-term 50% retracement level of $4069.54 and the 50-day moving average of $4134.03. If gold prices quickly break below $3832.46, the bearish expectation will strengthen, with the primary target at $3707.82. If the bulls recover the short-term 61.8% retracement level of $4027.90, the bearish expectation will weaken, and gold prices will have the opportunity to challenge the long-term 50% retracement level of $4069.54, the 50-day moving average of $4134.03, and the key high of $4148.71.
- Risk Warning and Disclaimer
- The market involves risk, and trading may not be suitable for all investors. This article is for reference only and does not constitute personal investment advice, nor does it take into account certain users’ specific investment objectives, financial situation, or other needs. Any investment decisions made based on this information are at your own risk.