Gold prices consolidate as stock markets weaken and concerns about economic growth intensify.
2026-11-17 22:00:30
On Tuesday (November 17), gold is currently consolidating below a key resistance level, withstanding pressure from rising real yields and a strengthening dollar. This may be an early sign of a shift in market momentum, but given the numerous unfavorable factors, gold prices still need a technical breakout to confirm a reversal. The market has likely largely priced in a hawkish Fed rate hike: the market widely expects a rate hike in December, and given that most Fed officials favor a small increase, the possibility of a 50 basis point hike is extremely low.  Market concerns about economic growth have finally begun to take hold, with the stock market almost erasing all of last week's gains and US Treasury yields gradually peaking and declining. As long as the US-Iran situation remains unresolved and the Federal Reserve maintains its hawkish stance, these economic concerns are likely to persist and even intensify. In the current environment, I believe that if the US-Iran standoff continues or the conflict escalates, inflation expectations will remain high, while the economic growth outlook will weaken, potentially leading to stagflation, which is ultimately bullish for gold. Conversely, if the situation sees a breakthrough and inflation concerns ease, the market will repric, betting on a dovish shift in the Federal Reserve, which will also support gold prices in the short term. However, currently, rising real yields and a stronger dollar continue to pose significant resistance to gold. Therefore, the above fundamental logic needs to be combined with technical signals to confirm a true shift in market momentum. Gold Technical Analysis – Daily Chart
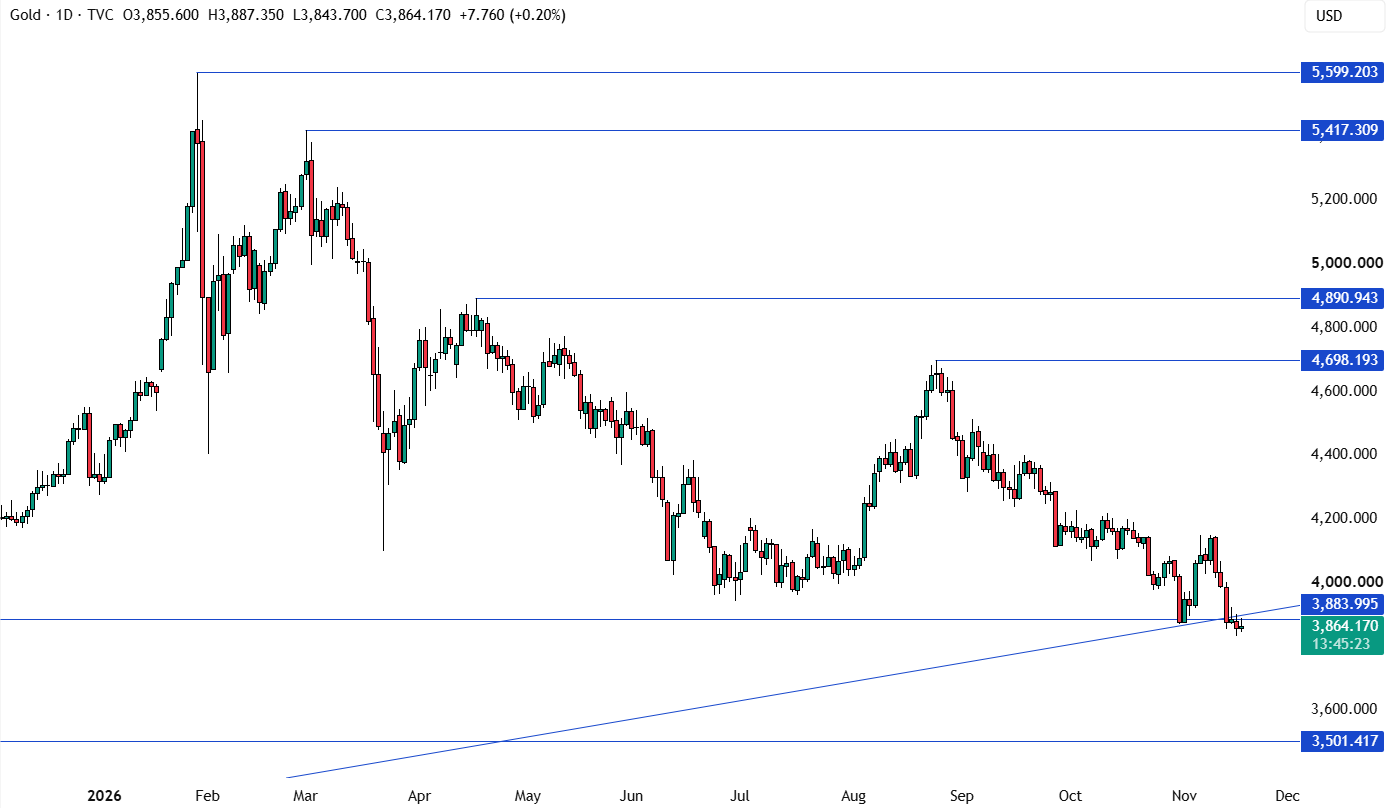 The daily chart shows that spot gold CFDs are consolidating around the key resistance zone of 3885, below the major upward trendline. It is expected that bears will continue to exert pressure around this range; if the price effectively breaks above the broken trendline, it indicates that the bears' stop-loss has failed, and the price will further decline to the 3500 level. Conversely, bulls need to see the price regain above this broken trendline before making a large-scale entry, targeting 4700. Gold Technical Analysis – 4-Hour Chart
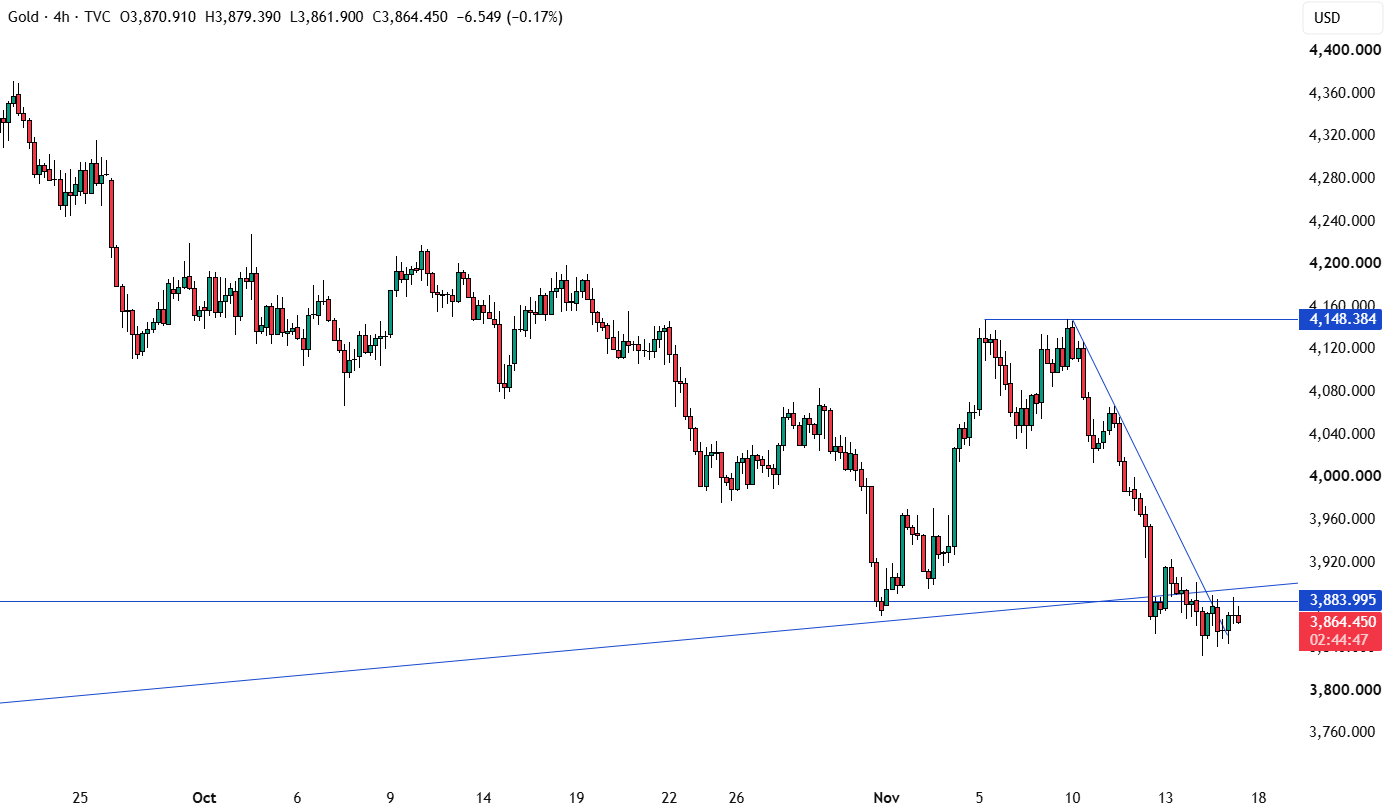 The 4-hour chart shows that gold prices have broken upwards through the downtrend line that previously dominated the decline, which could be an early signal of a momentum reversal. Bulls need to confirm that the price holds above this broken trendline to validate the potential reversal before making a major entry, with the first target at 4150 and a subsequent target of 4700. Bears, on the other hand, will continue to exert downward pressure around the current price level, constantly challenging new lows. Gold Technical Analysis – 1-Hour Chart
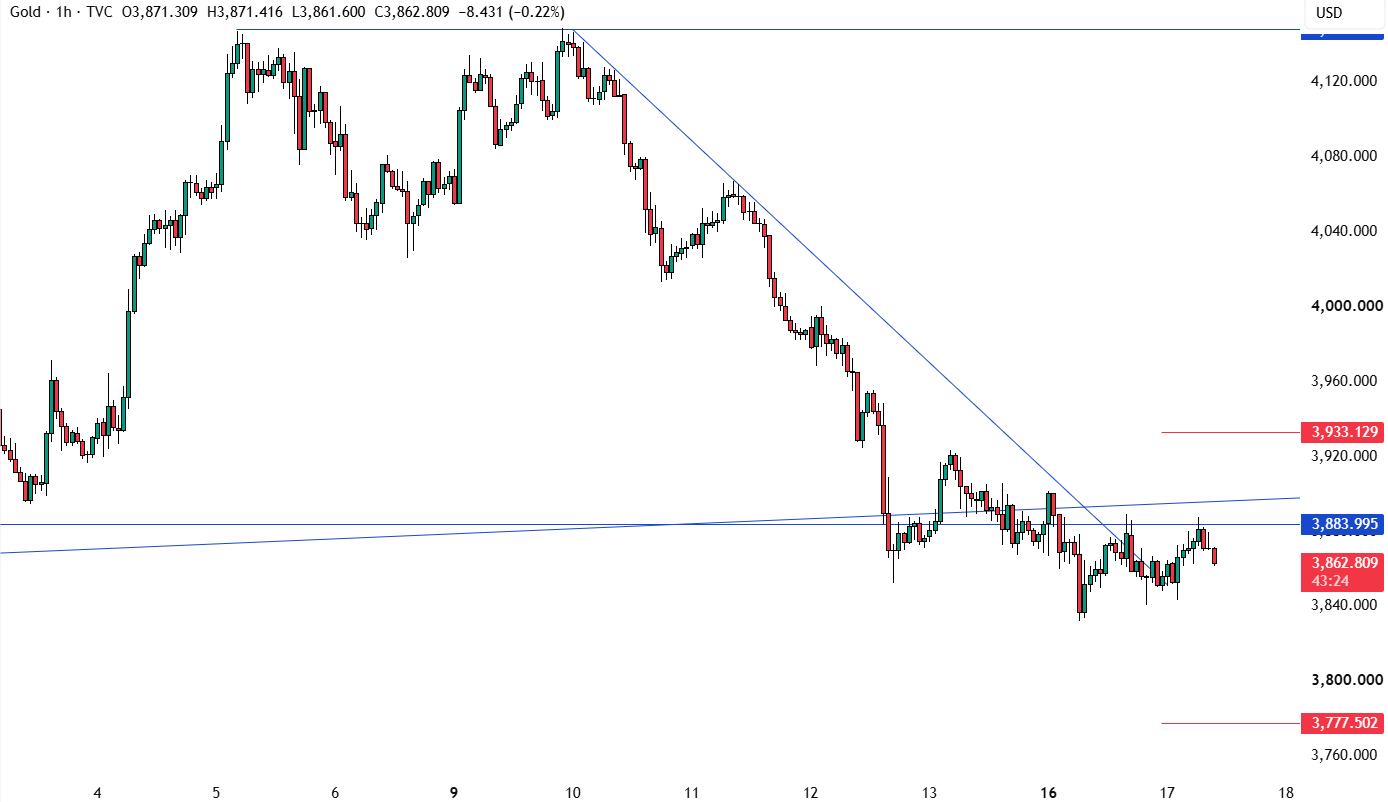 Gold prices are consolidating on the 1-hour chart, with no further signals. Bears will continue to exert pressure at the current price level, aiming for new lows; bulls must wait for the price to break above the trendline before considering long positions and betting on a price surge. The red line in the chart represents today's average daily trading range (ADR). Upcoming Market Drivers Economic Data Calendar: US retail sales data to be released soon; FOMC meeting minutes to be released tomorrow; latest US initial jobless claims to be released on Thursday. The market will continue to focus on speeches by Fed officials and developments in the US-Iran situation.
Market concerns about economic growth have finally begun to take hold, with the stock market almost erasing all of last week's gains and US Treasury yields gradually peaking and declining. As long as the US-Iran situation remains unresolved and the Federal Reserve maintains its hawkish stance, these economic concerns are likely to persist and even intensify. In the current environment, I believe that if the US-Iran standoff continues or the conflict escalates, inflation expectations will remain high, while the economic growth outlook will weaken, potentially leading to stagflation, which is ultimately bullish for gold. Conversely, if the situation sees a breakthrough and inflation concerns ease, the market will repric, betting on a dovish shift in the Federal Reserve, which will also support gold prices in the short term. However, currently, rising real yields and a stronger dollar continue to pose significant resistance to gold. Therefore, the above fundamental logic needs to be combined with technical signals to confirm a true shift in market momentum. Gold Technical Analysis – Daily Chart The daily chart shows that spot gold CFDs are consolidating around the key resistance zone of 3885, below the major upward trendline. It is expected that bears will continue to exert pressure around this range; if the price effectively breaks above the broken trendline, it indicates that the bears' stop-loss has failed, and the price will further decline to the 3500 level. Conversely, bulls need to see the price regain above this broken trendline before making a large-scale entry, targeting 4700. Gold Technical Analysis – 4-Hour Chart The 4-hour chart shows that gold prices have broken upwards through the downtrend line that previously dominated the decline, which could be an early signal of a momentum reversal. Bulls need to confirm that the price holds above this broken trendline to validate the potential reversal before making a major entry, with the first target at 4150 and a subsequent target of 4700. Bears, on the other hand, will continue to exert downward pressure around the current price level, constantly challenging new lows. Gold Technical Analysis – 1-Hour Chart Gold prices are consolidating on the 1-hour chart, with no further signals. Bears will continue to exert pressure at the current price level, aiming for new lows; bulls must wait for the price to break above the trendline before considering long positions and betting on a price surge. The red line in the chart represents today's average daily trading range (ADR). Upcoming Market Drivers Economic Data Calendar: US retail sales data to be released soon; FOMC meeting minutes to be released tomorrow; latest US initial jobless claims to be released on Thursday. The market will continue to focus on speeches by Fed officials and developments in the US-Iran situation.
- Risk Warning and Disclaimer
- The market involves risk, and trading may not be suitable for all investors. This article is for reference only and does not constitute personal investment advice, nor does it take into account certain users’ specific investment objectives, financial situation, or other needs. Any investment decisions made based on this information are at your own risk.