The US dollar index surged and then retreated: What signal did the unexpectedly high import prices send?
2026-11-17 22:00:31
On Tuesday, November 17th, the US released its October import and export price indices and retail sales data. Import prices rose 1.1% month-over-month, as did export prices, while retail sales increased 0.2% month-over-month and rose 6.8% nominally year-over-year. Following the data release, the US dollar index experienced a rapid rise followed by a decline. Overall, the simultaneous upward movement in international commodity prices and US domestic consumption data provides a new window for the market to reassess the inflation transmission path. 
Import and export prices continue to rise
U.S. import prices rose 1.1% month-over-month in October, matching the September increase and exceeding market expectations of 0.7%. Non-fuel import prices accelerated to 0.8%, further widening from the previous month's 0.5%. Fuel import prices rose 3.6%, petroleum and petroleum products rose 3.7%, and natural gas rose 5.1%. Non-fuel industrial supplies and materials rose 0.5%, and capital goods import prices rose 1.5%, the largest monthly increase since the series began being published monthly in December 1988, mainly driven by prices of computers, peripherals, semiconductors, and industrial and service machinery. Consumer goods (excluding automobiles) rose 0.5%, automobiles and parts rose 0.4%, while food, feed, and beverages fell 0.2%. Export prices rose 1.1% month-over-month, lower than the revised 2.4% in September. Agricultural exports rose 1.2%, and non-agricultural exports rose 1.1%. Non-agricultural industrial supplies and materials rose 2.1%, and consumer goods (excluding automobiles) rose 0.6%. Due to the interruption of federal government funding in 2025, the October year-on-year index, which relies on some survey data, could not be fully released. The market mainly relied on month-on-month changes to observe short-term price momentum. The unusually sharp rise in capital goods import prices reflects a concentrated increase in the cost of equipment and intermediate goods.Retail sales maintained nominal expansion
U.S. retail and food service sales reached $748.2 billion in October, up 0.2% month-over-month and 6.8% year-over-year in nominal terms. Excluding automobiles, sales rose 0.6%, and the control group (excluding automobiles, gasoline, building materials, and food services) also rose 0.6%, both exceeding expectations. Non-store retailers grew 1.2%, gasoline stations grew 1.5%, and building materials grew 0.5%. Furniture declined 2.3%, sporting goods and hobby products declined 0.7%, and restaurants and bars grew only 0.2%. These figures are nominal and do not adjust for price factors. Considering the recent 0.4% month-over-month increase in the Consumer Price Index, the actual sales expansion may be even narrower. September's data was revised upwards, with the excluding automobiles revised from 0.9% to 1.1%, and the control group revised from 0.1% to 0.5%. Housing-related categories performed weakly, consistent with sluggish housing market transactions. Overall retail sales continued to grow, but the growth rate slowed compared to the previous months, indicating that consumer spending maintained nominal expansion despite price pressures, but structurally it was more inclined towards online and energy-related categories.Price Transmission and Policy Path Observation
Rising import prices, particularly for capital goods and consumer goods, may be transmitted to the US domestic price system through business costs and retail channels. The 1.5% monthly increase in capital goods prices, related to demand for semiconductors and machinery, may impact business capital expenditure costs. The accelerating rise in non-fuel import prices echoes the recent 0.3% month-on-month and 6.5% year-on-year increases in the Producer Price Index, indicating that price pressures have spread from energy to a wider range of goods. The Federal Reserve has previously focused on the breadth of inflation. Market pricing of the policy rate path saw a slight adjustment after the data release, with expectations of a rate hike shifting slightly upward. Import prices do not include tariffs, so the impact of tariffs cannot be directly measured; however, the simultaneous rise in capital goods and consumer goods prices provides a reference for observing cost-push pressures. The simultaneous increase in export prices reflects the pricing power of US exports in the international market. Overall, the data reinforces the observation of inflation stickiness, but the strength of transmission still depends on business pricing power and demand elasticity.Characteristics of US Dollar Index Price Fluctuations
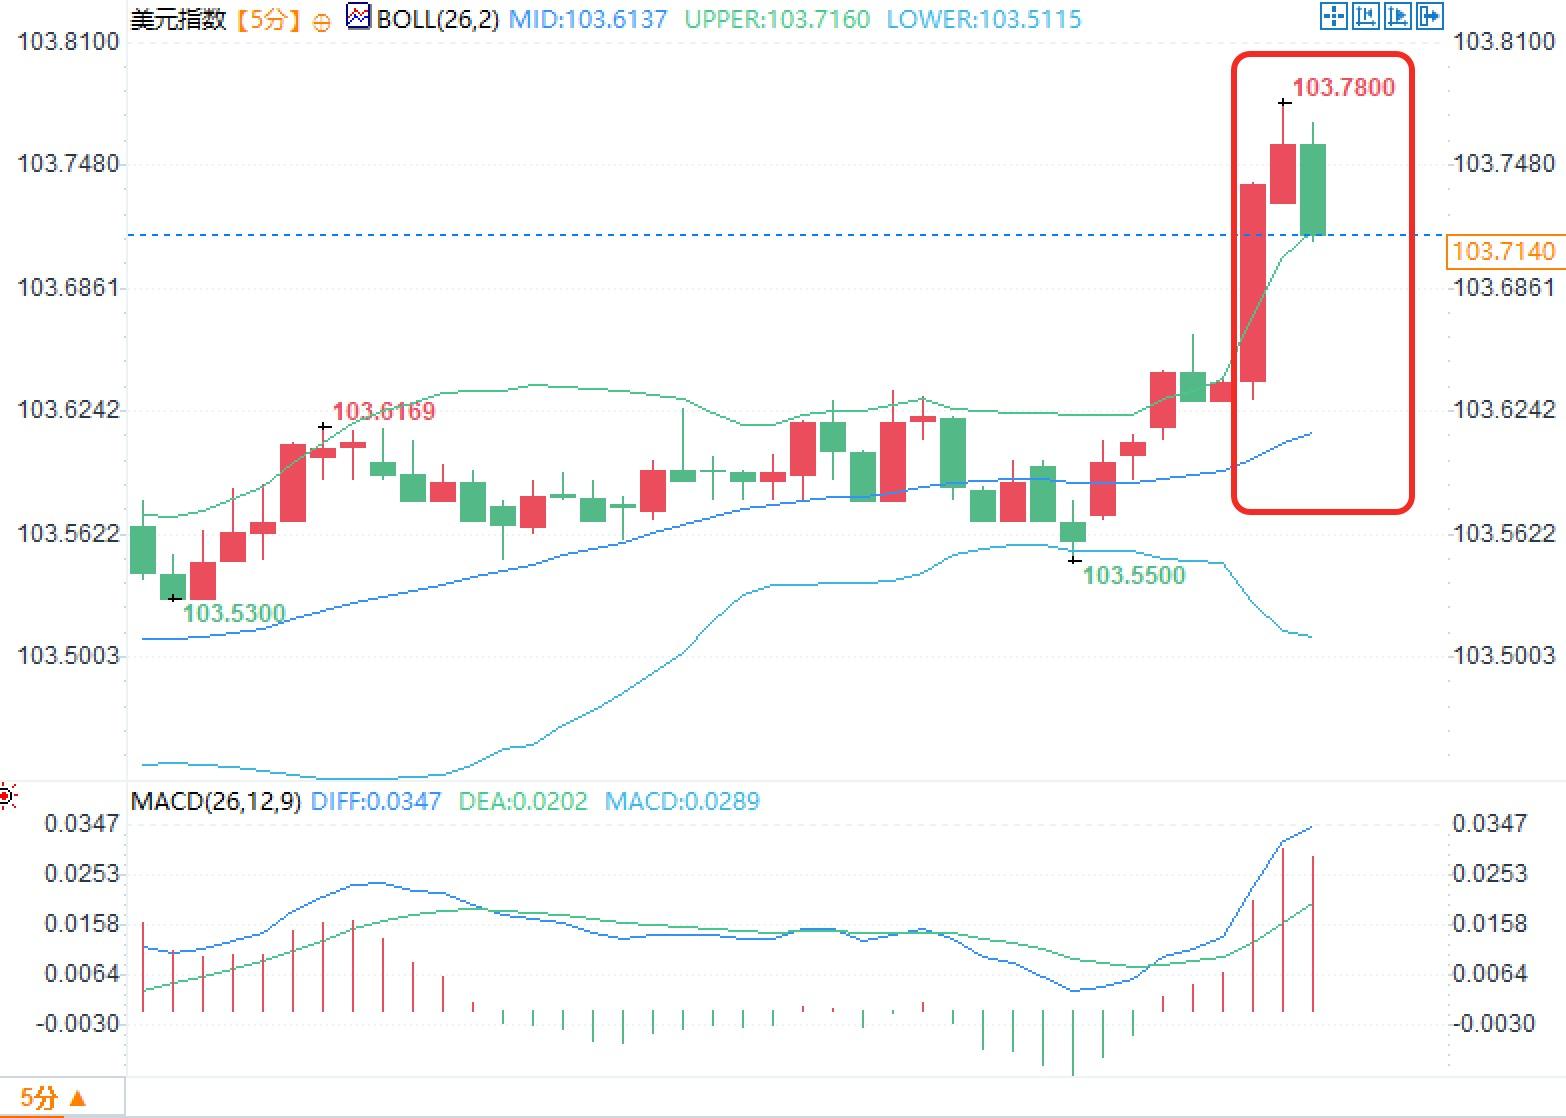
The 5-minute chart for the US Dollar Index shows the Bollinger Bands with the middle band at 103.6137, the upper band at 103.7160, and the lower band at 103.5115. After the data release, the price quickly surged to around 103.7800 before pulling back, and the latest price is hovering above the middle band. The MACD shows the DIFF at 0.0347, the DEA at 0.0202, and the histogram positive, with momentum still above the zero line. The price completed a rapid fluctuation within the 103.71-103.78 range before retracing, with the volatility exceeding that of previous trading sessions.Frequently Asked Questions
Question 1: Why did the price increase of capital goods imports reach a new high since 1988? Answer: Mainly driven by the prices of computers, peripherals, semiconductors, and industrial and service machinery, reflecting a concentrated release of demand for related equipment, leading to an overall increase in the import cost of capital goods. Question 2: Retail sales only increased by 0.2% month-on-month, why did the control group data show stronger performance? Answer: After excluding highly volatile categories such as automobiles and gasoline, the control group increased by 0.6%, showing that core commodity consumption remains resilient, but housing-related categories such as furniture dragged down the overall growth rate. Question 3: How does the rise in import prices affect the observation of domestic inflation in the United States? Answer: The simultaneous rise in import prices of capital goods and consumer goods may be passed on to downstream businesses through enterprise costs, echoing the recent rise in the producer price index, adding a dimension for observing inflation stickiness.- Risk Warning and Disclaimer
- The market involves risk, and trading may not be suitable for all investors. This article is for reference only and does not constitute personal investment advice, nor does it take into account certain users’ specific investment objectives, financial situation, or other needs. Any investment decisions made based on this information are at your own risk.