Gold prices fell further as a strong dollar and high yields exerted downward pressure.
2026-11-18 17:34:30
On Wednesday (November 18), the sell-off in gold intensified during the European trading session, although there was no direct trigger for this decline. Following hawkish comments from the Federal Reserve and US CPI data exceeding market expectations, market pricing shifted towards a hawkish stance. Rising US Treasury yields and a stronger dollar created strong negative factors, causing gold prices to continue their downward trend.  Currently, the bearish momentum remains strong, and no bullish drivers have emerged to reverse the trend. However, the market repricing towards a hawkish stance is likely nearing its end: the market widely expects a rate hike in December, and given that most Fed officials favor a small increase, the possibility of a 50 basis point hike is extremely low. Furthermore, market concerns about economic growth are finally taking hold, with the stock market fluctuating near last week's lows and US Treasury yields gradually peaking and declining. As long as the US-Iran situation remains unresolved and the Fed maintains a hawkish stance, these growth concerns are likely to persist and even intensify. In the current environment, a prolonged stalemate or escalation of the conflict between the US and Iran would push up inflation expectations, while a weakening economic growth outlook would fuel stagflation expectations, which ultimately benefits gold. Conversely, if the US-Iran situation improves and inflation concerns ease, the market would shift to dovish pricing, which would also benefit gold in the short term. Gold is currently facing numerous bearish factors, therefore, the above fundamental assessment needs to be combined with technical signals to confirm a shift in market momentum. If the stock market continues to decline, concerns about economic growth will become the core issue in the market. At that time, US Treasury yields and the US dollar are expected to weaken in tandem, which would benefit this precious metal. Gold Technical Analysis – Daily Chart
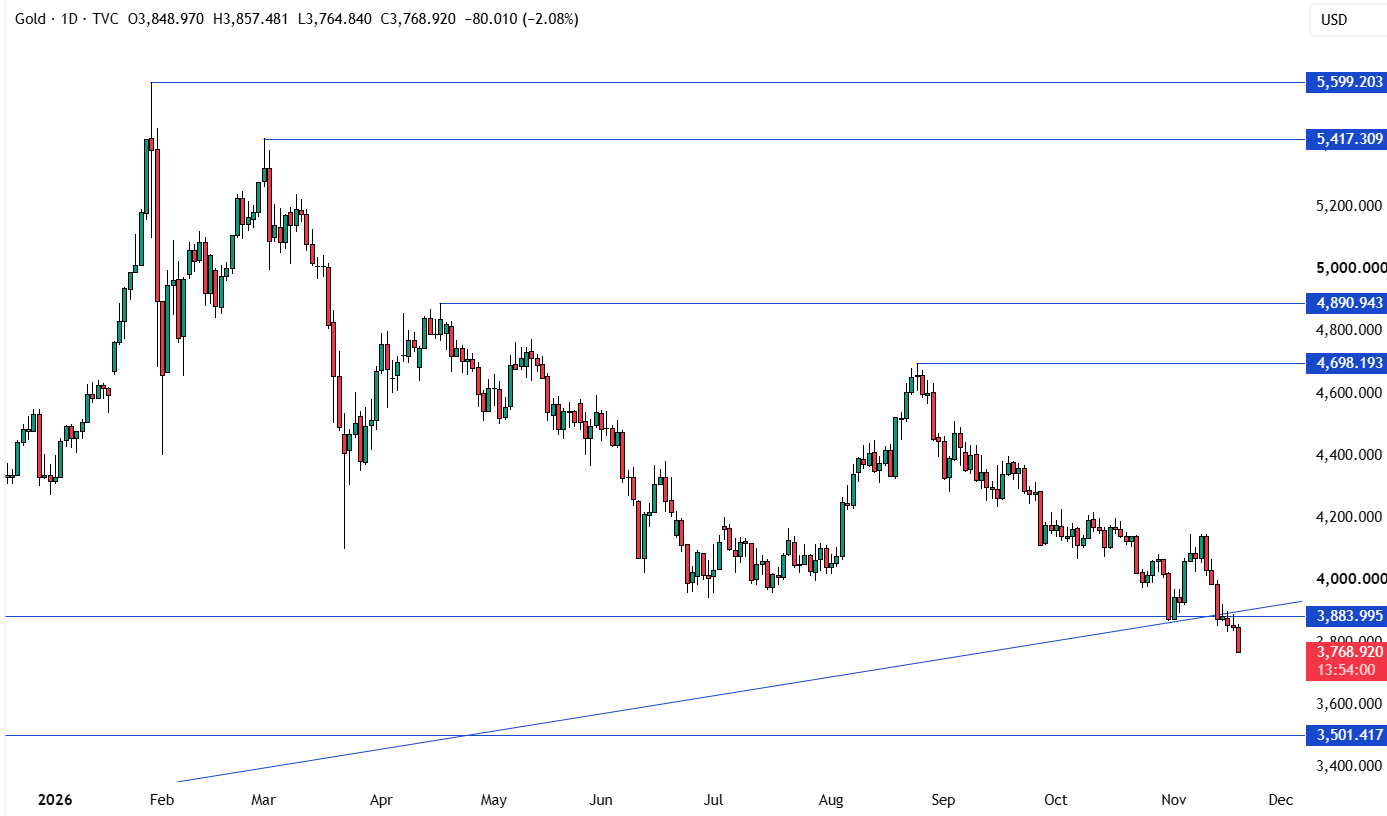 As seen on the daily chart, after a brief consolidation below the key level of 3885, spot gold CFDs extended their losses further. The primary target for bears is the 3500 level. If the price touches this level, buying is expected to enter the market, with stop-loss orders placed below this level, betting on a rebound to 4700. Conversely, if bears push the price below 3500, they will increase their bearish bets, with the next target at 3100. Gold Technical Analysis – 4-Hour Chart
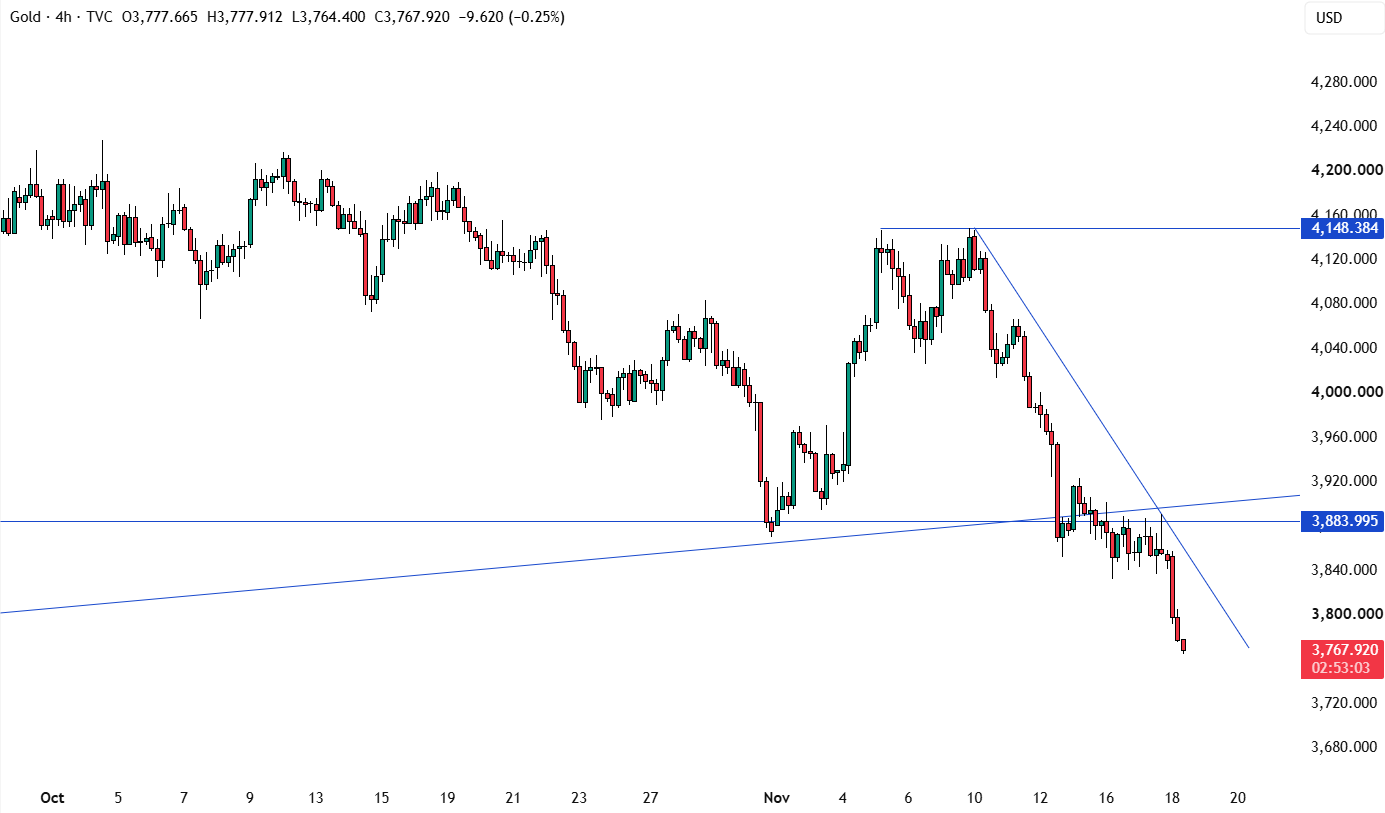 On the 4-hour chart, a downward trend line outlines the current bearish momentum. If gold prices rebound, short sellers will likely use this trend line as a base to establish positions, with stop-loss orders placed above the trend line, targeting the 3500 level. Long positions, on the other hand, will only enter aggressively after seeing the price break above this trend line, betting on a rebound to 4150. Gold Technical Analysis – 1-Hour Chart
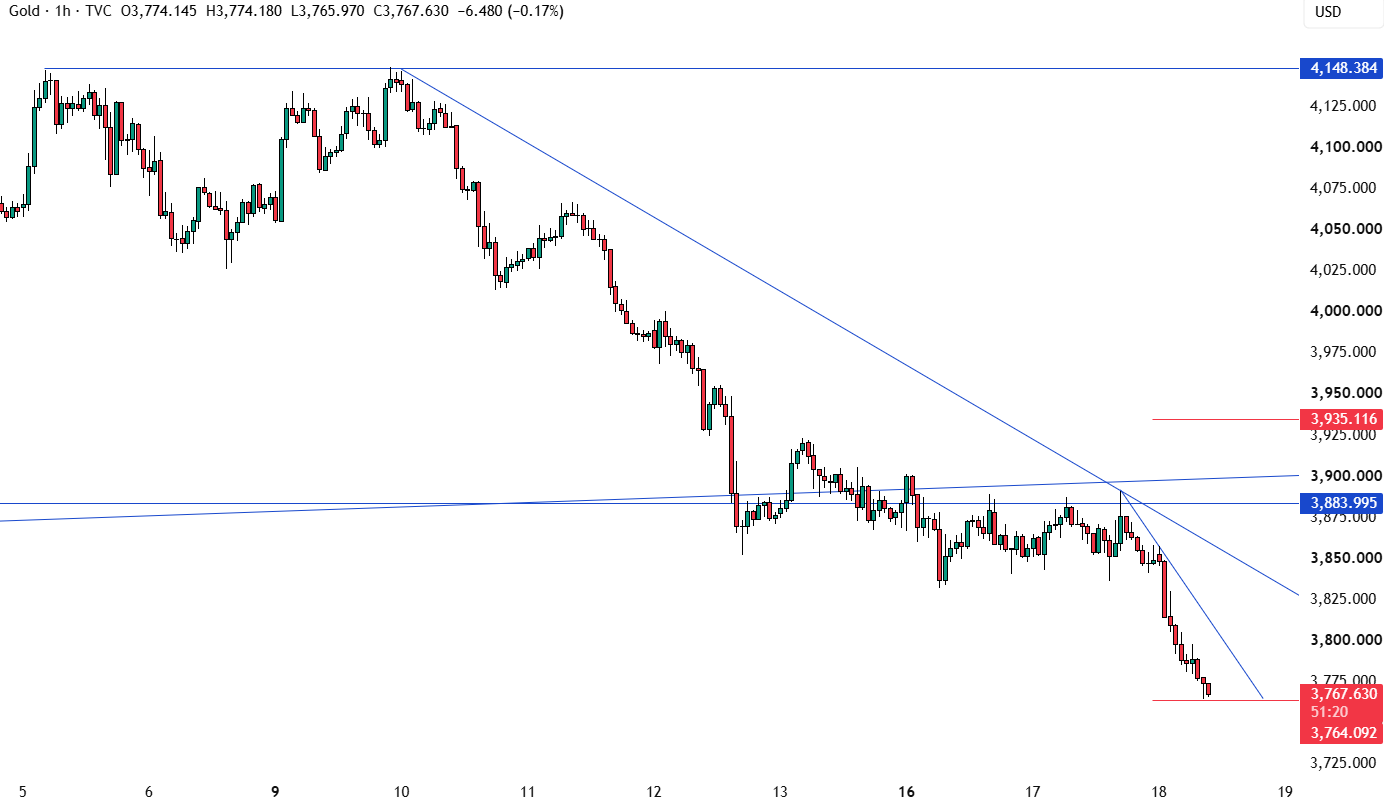 On the 1-hour chart, a secondary downtrend line represents the bearish momentum within this timeframe. Bears may operate based on this trend line, placing stop-loss orders above it, continuously pushing gold prices to new lows. Bulls, on the other hand, need the price to break above the trend line to push a rebound towards the primary downtrend line. The red line in the chart represents today's average daily trading range (ADR).
Currently, the bearish momentum remains strong, and no bullish drivers have emerged to reverse the trend. However, the market repricing towards a hawkish stance is likely nearing its end: the market widely expects a rate hike in December, and given that most Fed officials favor a small increase, the possibility of a 50 basis point hike is extremely low. Furthermore, market concerns about economic growth are finally taking hold, with the stock market fluctuating near last week's lows and US Treasury yields gradually peaking and declining. As long as the US-Iran situation remains unresolved and the Fed maintains a hawkish stance, these growth concerns are likely to persist and even intensify. In the current environment, a prolonged stalemate or escalation of the conflict between the US and Iran would push up inflation expectations, while a weakening economic growth outlook would fuel stagflation expectations, which ultimately benefits gold. Conversely, if the US-Iran situation improves and inflation concerns ease, the market would shift to dovish pricing, which would also benefit gold in the short term. Gold is currently facing numerous bearish factors, therefore, the above fundamental assessment needs to be combined with technical signals to confirm a shift in market momentum. If the stock market continues to decline, concerns about economic growth will become the core issue in the market. At that time, US Treasury yields and the US dollar are expected to weaken in tandem, which would benefit this precious metal. Gold Technical Analysis – Daily Chart As seen on the daily chart, after a brief consolidation below the key level of 3885, spot gold CFDs extended their losses further. The primary target for bears is the 3500 level. If the price touches this level, buying is expected to enter the market, with stop-loss orders placed below this level, betting on a rebound to 4700. Conversely, if bears push the price below 3500, they will increase their bearish bets, with the next target at 3100. Gold Technical Analysis – 4-Hour Chart On the 4-hour chart, a downward trend line outlines the current bearish momentum. If gold prices rebound, short sellers will likely use this trend line as a base to establish positions, with stop-loss orders placed above the trend line, targeting the 3500 level. Long positions, on the other hand, will only enter aggressively after seeing the price break above this trend line, betting on a rebound to 4150. Gold Technical Analysis – 1-Hour Chart On the 1-hour chart, a secondary downtrend line represents the bearish momentum within this timeframe. Bears may operate based on this trend line, placing stop-loss orders above it, continuously pushing gold prices to new lows. Bulls, on the other hand, need the price to break above the trend line to push a rebound towards the primary downtrend line. The red line in the chart represents today's average daily trading range (ADR).
- Risk Warning and Disclaimer
- The market involves risk, and trading may not be suitable for all investors. This article is for reference only and does not constitute personal investment advice, nor does it take into account certain users’ specific investment objectives, financial situation, or other needs. Any investment decisions made based on this information are at your own risk.