A stronger dollar and hawkish expectations from the Federal Reserve triggered a new round of gold selling.
2026-11-18 19:22:33
Federal Reserve officials Mussalem and Logan expressed their belief that further interest rate hikes were necessary, putting further pressure on gold prices. Gold prices fell sharply in early trading on Wednesday (November 18). Currently, gold prices are testing the lows since September 26, 2025. The core driver of this sell-off is the strengthening dollar coupled with the Fed's hawkish policy outlook. Meanwhile, the market is awaiting the release of the Fed's October meeting minutes at 03:00 Beijing time; these minutes could either alleviate downward pressure on gold prices or amplify the sell-off, and will also signal the number of future interest rate hikes and the duration of continued policy tightening.  Market Focus: Fed Meeting Minutes and Hawkish Remarks Since the last policy meeting, several Fed officials have expressed support for continued rate hikes, so the minutes of this meeting are unlikely to bring any unexpected shocks. Furthermore, the market's movements, including rising US Treasury yields to multi-year highs, a stronger dollar, and a simultaneous drop in gold and silver prices, clearly reflect the expectations of the trading community. On Tuesday, New York Fed President John Williams stated that the Fed will likely need to raise rates again to curb inflationary pressures, but he did not indicate that the Fed would shift to a more aggressive pace of rate hikes. St. Louis Fed President Alberto Musaleem warned that the Fed may need to raise rates multiple times before next spring to control inflation. Dallas Fed President Lori Logan suggested that at least two more 25-basis-point rate hikes are needed; she also stated that if inflation remains high, the Fed may accelerate the pace of rate hikes. A Stronger Dollar Further Drags Down Gold The Fed's hawkish comments alone are not enough to drag down gold prices. In the author's view, the continuously rising dollar and the chain reaction of pressure that a stronger dollar brings to the global financial system are the core variables. The US dollar is not only the currency of the United States, but also the cornerstone of global lending, international trade, and financial settlement. The current gold price trend is reminiscent of the market's scramble for dollar liquidity at the beginning of the COVID-19 pandemic. Large global investors appear to be selling off various assets, including gold, in exchange for dollars. The author believes that the longer the dollar's strength continues, the higher the risk of a deep drop in gold prices. The gold price increase in 2025 was based on the bet on two to three interest rate cuts in 2026; now the market has reversed, and the gold price decline may mirror the previous upward trend. For gold bulls, the positive factor is that this decline may not last indefinitely: at some point in the future, a liquidity crisis may force global policymakers to introduce strong easing policies, or even restart quantitative easing (QE). Increased market volatility requires investors to be prepared, and gold prices may continue to face downward pressure. Spot Gold Weekly Technical Analysis
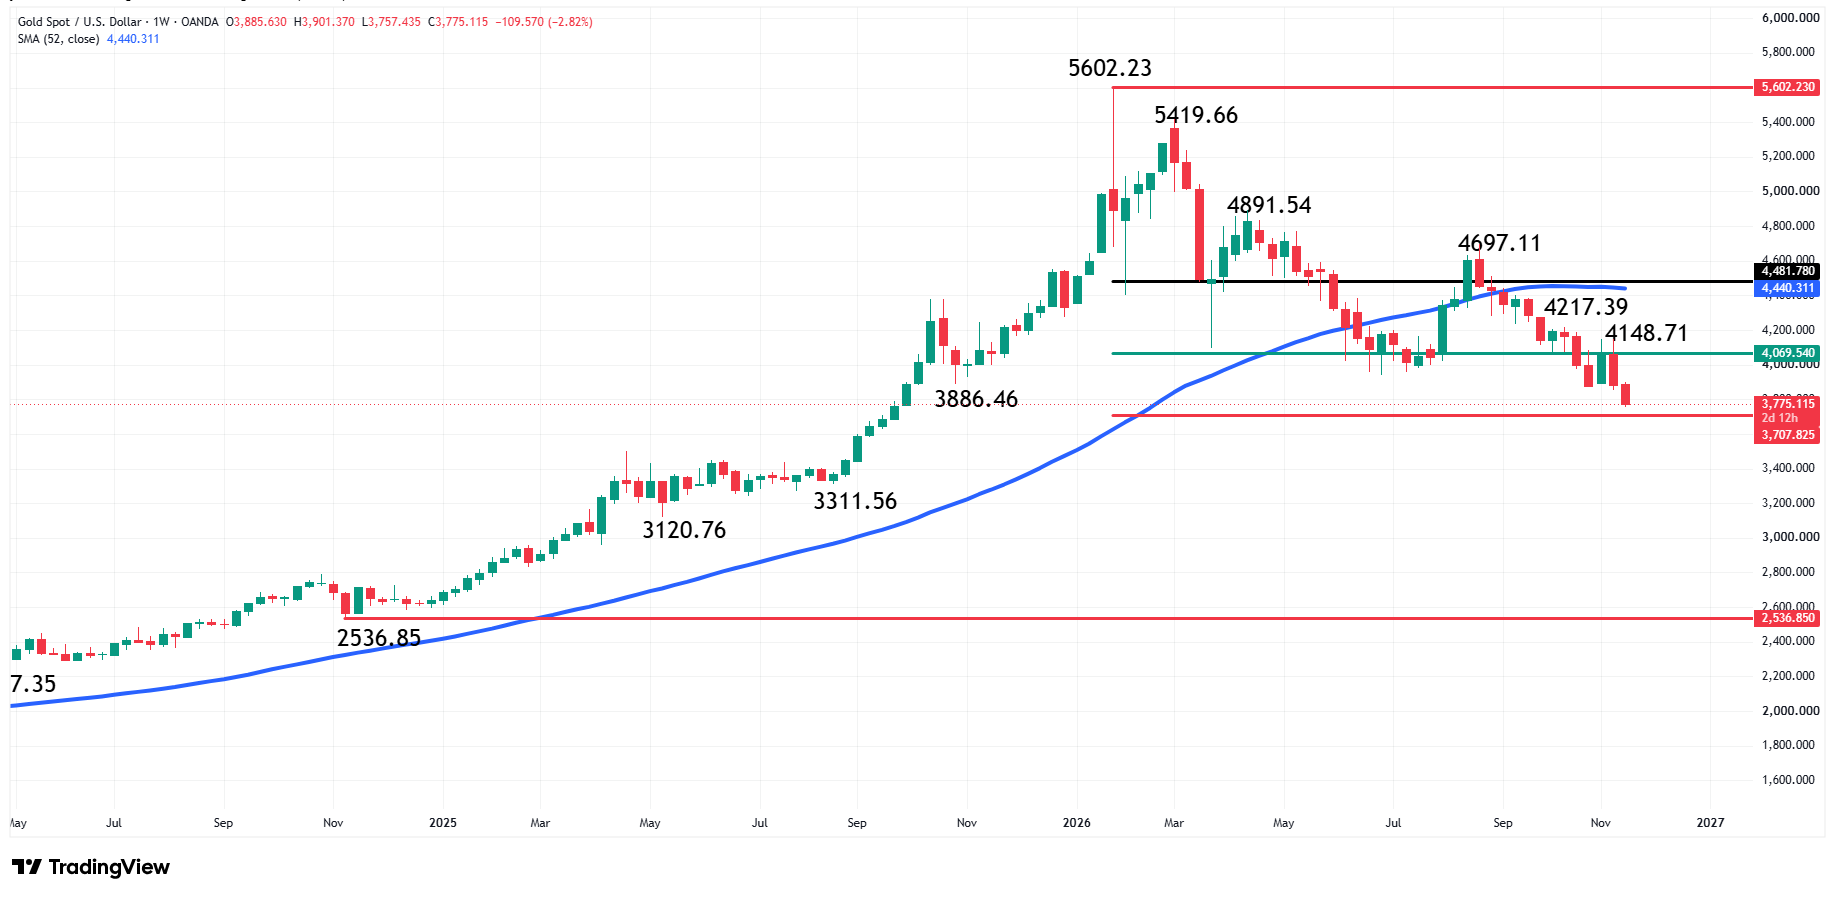 Gold prices weakened significantly this week, falling below Tuesday's low of $3832.46. Based on the weekly oscillation structure, the main trend is downward; only a break above the key high of $4148.71 will reverse the main trend to upward. This article defines the long-term trading range as $2536.85–$5602.23. $2536.85 is a significant bottom from November 2024, and the upward movement from this point to the historical high in January 2026 is calculated. The retracement zone formed by this range is between $4069.54 and $3707.82, and spot gold is currently trading within this range. Some investors view this range as a value buying zone, while others believe it is merely a continuation pattern for further downward movement. Resistance: $4481.78 is a key level that long-term bulls must overcome, representing a 20% drop from the historical high of $5602.23. Traditional technical analysis schools generally consider this price level as the starting point of a bear market. However, in the author's framework, a sustained hold above this level is a crucial signal for the start of a new bull market. The author judges trend reversals by focusing more on candlestick patterns and structures than on a single price level. (Spot Gold Daily Chart Technical Analysis)
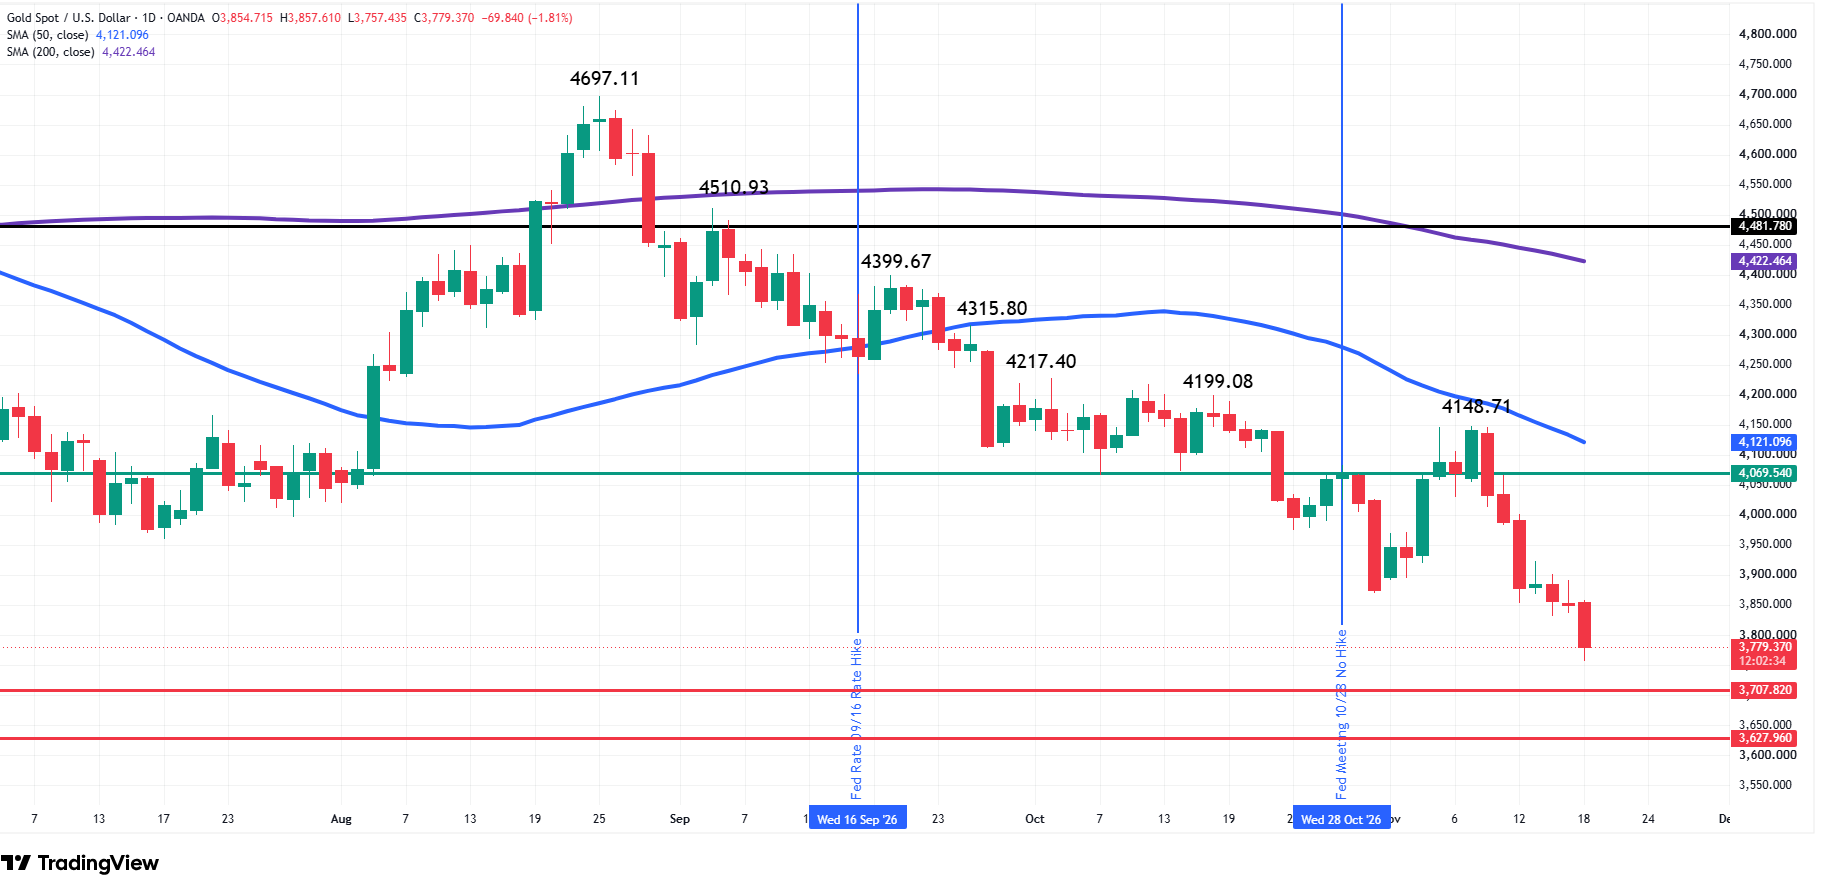 The daily chart's oscillating structure indicates a downward trend. Gold prices breaking below $3832.46 signifies a resumption of the downtrend. The next key target is the long-term 61.8% Fibonacci retracement level at $3707.82, followed by the long-term bottom at $3627.96. Only a break above the previous high of $4148.71 would signal an upward shift in the daily trend. This breakout point coincides with the long-term 50% retracement level at $4069.54 and the 50-day moving average at $4121.14; a successful breakout would represent a substantial shift in momentum. Key signals to watch : Weekly Chart Perspective The weekly chart is bearish: the oscillating chart shows a downward trend, with gold prices significantly below the 52-week moving average trend indicator, indicating a bear market structure. Traders can consider value opportunities within the long-term retracement range of $4069.54 to $3707.82. A break below $3707.82 would further reinforce the bearish outlook; a hold above $4069.54 would be the first warning sign of weakening bearish momentum; a break above the swing high of $4148.71 would shift the author's stance to bullish. Daily Chart View The daily chart is bearish: the main trend is downward, and gold prices are below the long-term 50% retracement level of $4069.54 and the 50-day moving average of $4121.14. After the support at $3832.46 is breached, the first target is $3707.82, followed by $3627.96.
Market Focus: Fed Meeting Minutes and Hawkish Remarks Since the last policy meeting, several Fed officials have expressed support for continued rate hikes, so the minutes of this meeting are unlikely to bring any unexpected shocks. Furthermore, the market's movements, including rising US Treasury yields to multi-year highs, a stronger dollar, and a simultaneous drop in gold and silver prices, clearly reflect the expectations of the trading community. On Tuesday, New York Fed President John Williams stated that the Fed will likely need to raise rates again to curb inflationary pressures, but he did not indicate that the Fed would shift to a more aggressive pace of rate hikes. St. Louis Fed President Alberto Musaleem warned that the Fed may need to raise rates multiple times before next spring to control inflation. Dallas Fed President Lori Logan suggested that at least two more 25-basis-point rate hikes are needed; she also stated that if inflation remains high, the Fed may accelerate the pace of rate hikes. A Stronger Dollar Further Drags Down Gold The Fed's hawkish comments alone are not enough to drag down gold prices. In the author's view, the continuously rising dollar and the chain reaction of pressure that a stronger dollar brings to the global financial system are the core variables. The US dollar is not only the currency of the United States, but also the cornerstone of global lending, international trade, and financial settlement. The current gold price trend is reminiscent of the market's scramble for dollar liquidity at the beginning of the COVID-19 pandemic. Large global investors appear to be selling off various assets, including gold, in exchange for dollars. The author believes that the longer the dollar's strength continues, the higher the risk of a deep drop in gold prices. The gold price increase in 2025 was based on the bet on two to three interest rate cuts in 2026; now the market has reversed, and the gold price decline may mirror the previous upward trend. For gold bulls, the positive factor is that this decline may not last indefinitely: at some point in the future, a liquidity crisis may force global policymakers to introduce strong easing policies, or even restart quantitative easing (QE). Increased market volatility requires investors to be prepared, and gold prices may continue to face downward pressure. Spot Gold Weekly Technical Analysis Gold prices weakened significantly this week, falling below Tuesday's low of $3832.46. Based on the weekly oscillation structure, the main trend is downward; only a break above the key high of $4148.71 will reverse the main trend to upward. This article defines the long-term trading range as $2536.85–$5602.23. $2536.85 is a significant bottom from November 2024, and the upward movement from this point to the historical high in January 2026 is calculated. The retracement zone formed by this range is between $4069.54 and $3707.82, and spot gold is currently trading within this range. Some investors view this range as a value buying zone, while others believe it is merely a continuation pattern for further downward movement. Resistance: $4481.78 is a key level that long-term bulls must overcome, representing a 20% drop from the historical high of $5602.23. Traditional technical analysis schools generally consider this price level as the starting point of a bear market. However, in the author's framework, a sustained hold above this level is a crucial signal for the start of a new bull market. The author judges trend reversals by focusing more on candlestick patterns and structures than on a single price level. (Spot Gold Daily Chart Technical Analysis) The daily chart's oscillating structure indicates a downward trend. Gold prices breaking below $3832.46 signifies a resumption of the downtrend. The next key target is the long-term 61.8% Fibonacci retracement level at $3707.82, followed by the long-term bottom at $3627.96. Only a break above the previous high of $4148.71 would signal an upward shift in the daily trend. This breakout point coincides with the long-term 50% retracement level at $4069.54 and the 50-day moving average at $4121.14; a successful breakout would represent a substantial shift in momentum. Key signals to watch : Weekly Chart Perspective The weekly chart is bearish: the oscillating chart shows a downward trend, with gold prices significantly below the 52-week moving average trend indicator, indicating a bear market structure. Traders can consider value opportunities within the long-term retracement range of $4069.54 to $3707.82. A break below $3707.82 would further reinforce the bearish outlook; a hold above $4069.54 would be the first warning sign of weakening bearish momentum; a break above the swing high of $4148.71 would shift the author's stance to bullish. Daily Chart View The daily chart is bearish: the main trend is downward, and gold prices are below the long-term 50% retracement level of $4069.54 and the 50-day moving average of $4121.14. After the support at $3832.46 is breached, the first target is $3707.82, followed by $3627.96.
- Risk Warning and Disclaimer
- The market involves risk, and trading may not be suitable for all investors. This article is for reference only and does not constitute personal investment advice, nor does it take into account certain users’ specific investment objectives, financial situation, or other needs. Any investment decisions made based on this information are at your own risk.