CBOT agricultural commodity analysis: The dollar hit a 19-month high, causing wheat to fall 4% in one day, and corn to hit a new low since the end of June.
2026-11-19 09:12:36
On Wednesday (November 18), Chicago Board of Trade (CBOT) grain futures weakened across the board, pressured by the US dollar index surging to a 19-month high. Wednesday's decline was among the heaviest in recent months. March wheat settled at $5.86 per bushel, down 3.97% on the day, having touched $5.85 per bushel during the session, its lowest since January. December corn settled at $4.355 per bushel, down 2.52%, with an intraday low of $4.342 per bushel, its lowest since June 30. January soybeans were relatively resilient, settling at $12.167 per bushel, down 0.71%. Kansas City December hard red winter soybeans also fell 23.75 cents to $6.092 per bushel. The driving force behind this round of decline is not the supply and demand table itself, but rather two lines: macroeconomics and positioning. A stronger dollar weakens the competitiveness of US grain exports, while a decline in crude oil prices drags down sentiment in edible oils and biodiesel. Fund operations on Wednesday were described by market participants as a three-pronged approach: "adding to short positions in wheat, adding to short positions in corn, and continuing to reduce long positions in soybeans." Looking at the market action on Tuesday, Wednesday, and Thursday in conjunction with the spot basis, the nature of this decline is a technical sell-off under macroeconomic pressure, and the signals from the spot market do not support a one-sided bearish outlook.  As of 09:01 AM today (November 19th) in the Asian morning session, here is a summary of the price changes for related commodities.
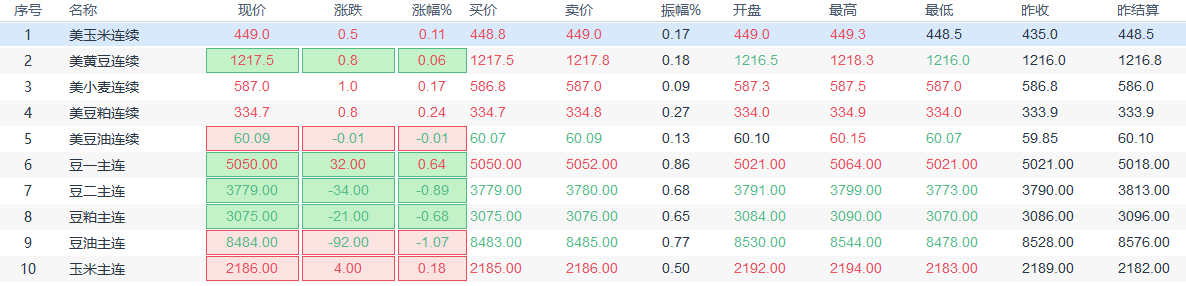 According to FX678's observations, estimates from overseas traders show that on Wednesday (November 18th), the speculative positions of commodity funds on corn futures, soybean futures, wheat futures, soybean meal futures, and soybean oil futures at the Chicago Board of Trade (CBOT), specifically the net positions and average net positions of CBOT commodity funds, are shown in the chart below created by FX678.
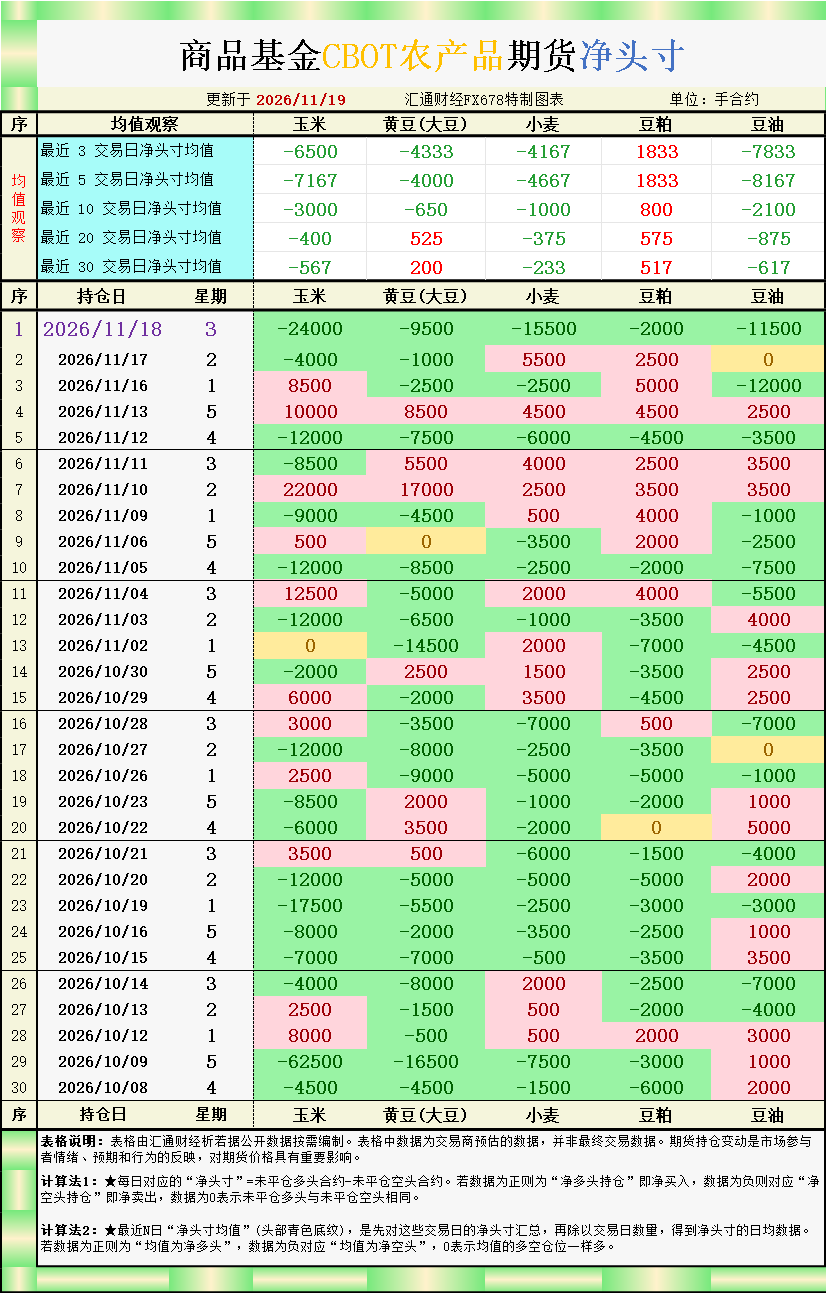 The following is an interpretation of the net positions and averages in the above position charts: [CBOT corn speculative positions: net selling of 24,000 contracts; average net selling of 6,500 contracts over the past 3 trading days; average net selling of 7,167 contracts over the past 5 trading days; average net selling of 3,000 contracts over the past 10 trading days; average net selling of 400 contracts over the past 20 trading days; average net selling of 567 contracts over the past 30 trading days.] [CBOT soybean speculative positions: net selling of 9,500 contracts; average net selling of 4,333 contracts over the past 3 trading days; average net selling of 4,000 contracts over the past 5 trading days; average net selling of 650 contracts over the past 10 trading days; average net buying of 525 contracts over the past 20 trading days; average net buying of 200 contracts over the past 30 trading days.] [CBOT wheat speculative positions are net sold at 15,500 contracts; the average net position over the past 3 trading days is net sold at 4,167 contracts; the average net position over the past 5 trading days is net sold at 4,667 contracts; the average net position over the past 10 trading days is net sold at 1,000 contracts; the average net position over the past 20 trading days is net sold at 375 contracts; and the average net position over the past 30 trading days is net sold at 233 contracts.] [CBOT soybean meal speculative positions are net sold at 2,000 contracts; the average net position over the past 3 trading days is net bought at 1,833 contracts; the average net position over the past 5 trading days is net bought at 1,833 contracts; the average net position over the past 10 trading days is net bought at 800 contracts; the average net position over the past 20 trading days is net bought at 575 contracts; and the average net position over the past 30 trading days is net bought at 517 contracts.] [CBOT soybean oil speculative positions are net sold at 11,500 contracts; the average net position over the past 3 trading days is net sold at 7,833 contracts; the average net position over the past 5 trading days is net sold at 8,167 contracts; the average net position over the past 10 trading days is net sold at 2,100 contracts; the average net position over the past 20 trading days is net sold at 875 contracts; and the average net position over the past 30 trading days is net sold at 617 contracts.] CBOT grain open interest, basis, and international supply and demand reveal new market trends. Detailed analysis of each commodity is provided below:
As of 09:01 AM today (November 19th) in the Asian morning session, here is a summary of the price changes for related commodities. According to FX678's observations, estimates from overseas traders show that on Wednesday (November 18th), the speculative positions of commodity funds on corn futures, soybean futures, wheat futures, soybean meal futures, and soybean oil futures at the Chicago Board of Trade (CBOT), specifically the net positions and average net positions of CBOT commodity funds, are shown in the chart below created by FX678. The following is an interpretation of the net positions and averages in the above position charts: [CBOT corn speculative positions: net selling of 24,000 contracts; average net selling of 6,500 contracts over the past 3 trading days; average net selling of 7,167 contracts over the past 5 trading days; average net selling of 3,000 contracts over the past 10 trading days; average net selling of 400 contracts over the past 20 trading days; average net selling of 567 contracts over the past 30 trading days.] [CBOT soybean speculative positions: net selling of 9,500 contracts; average net selling of 4,333 contracts over the past 3 trading days; average net selling of 4,000 contracts over the past 5 trading days; average net selling of 650 contracts over the past 10 trading days; average net buying of 525 contracts over the past 20 trading days; average net buying of 200 contracts over the past 30 trading days.] [CBOT wheat speculative positions are net sold at 15,500 contracts; the average net position over the past 3 trading days is net sold at 4,167 contracts; the average net position over the past 5 trading days is net sold at 4,667 contracts; the average net position over the past 10 trading days is net sold at 1,000 contracts; the average net position over the past 20 trading days is net sold at 375 contracts; and the average net position over the past 30 trading days is net sold at 233 contracts.] [CBOT soybean meal speculative positions are net sold at 2,000 contracts; the average net position over the past 3 trading days is net bought at 1,833 contracts; the average net position over the past 5 trading days is net bought at 1,833 contracts; the average net position over the past 10 trading days is net bought at 800 contracts; the average net position over the past 20 trading days is net bought at 575 contracts; and the average net position over the past 30 trading days is net bought at 517 contracts.] [CBOT soybean oil speculative positions are net sold at 11,500 contracts; the average net position over the past 3 trading days is net sold at 7,833 contracts; the average net position over the past 5 trading days is net sold at 8,167 contracts; the average net position over the past 10 trading days is net sold at 2,100 contracts; the average net position over the past 20 trading days is net sold at 875 contracts; and the average net position over the past 30 trading days is net sold at 617 contracts.] CBOT grain open interest, basis, and international supply and demand reveal new market trends. Detailed analysis of each commodity is provided below:Wheat: 15,500 short positions added in a single day; the Crimean Bridge only resulted in a one-day rebound.
This week's wheat price movement clearly demonstrated the difference between "event-driven" and "trend-suppressed" factors. On Tuesday, Ukraine launched an attack on the central section of the Crimean Bridge, disrupting shipping in the Sea of Azov and causing a rebound in prices. However, on Wednesday, the US dollar surged to a 19-month high, and the March contract immediately erased all of the previous day's gains, hitting a new low since January, with a single-day drop of nearly 4%. Funds net sold 15,500 contracts that day, the most concentrated short selling among the three commodities, and the recent 3-day and 5-day averages were 4,167 and 4,667 contracts respectively, indicating that the short selling was not a one-day event but rather a directional bet over several days. Traders explained that shipping traffic in the Sea of Azov and the Black Sea had already shrunk significantly in previous months due to drone attacks, and the market had long been insensitive to such supply disruptions. Furthermore, the upcoming harvest in the Southern Hemisphere would replenish global supply, significantly discounting the marginal impact of the event. However, the spot market did not collapse along with the futures market. The basis for hard red winter wheat in the U.S. Plains region remained stable on Wednesday, with thin spot trading. The premium for Kansas City railroad wheat against 11.80% to 12.00% protein grades was reduced by 4 cents per bushel, while other grades remained unchanged, a routine adjustment to quality spreads. On the international trading front, Turkey's state-owned grain agency initially sold approximately 100,000 tons of durum wheat in its export tender, while Bangladesh's tender for 50,000 tons of milling wheat awaits its November 22nd deadline. The ongoing buyer tenders indicate that global demand has not disappeared; however, a stronger dollar has put U.S. grains at a price disadvantage. Wheat futures are thus caught in a sandwich of "funds adding short positions supported by the dollar, and a stable basis supported by tenders." After breaking the previous low of $5.85 per bushel, further downward movement requires confirmation from either a further strengthening dollar or a substantial deterioration in export data.Corn: Net selling of 24,000 lots was the largest in the market, but South Korean buyers specifically requested South American corn.
Corn futures hit a low of $4.342 per bushel on Wednesday, the lowest since June 30, before closing at $4.355 per bushel, down 11.25 cents. Funds net sold 24,000 contracts, the largest single-day net selling volume among the five commodities. The recent five-day average net selling of 7,167 contracts was also higher than the three-day average, indicating an accelerated pace of short selling over the past week. However, juxtaposing the basis and export figures, the signals from the spot market do not support a one-sided bearish outlook. Regarding the basis, on Tuesday, a corn processor in Cedar Rapids, Iowa, lowered its cash basis for deliveries before Sunday by 3 cents to a 1-cent discount to December futures, but raised its quotes for deliveries from then until the end of the month to a 3-cent premium—a structure of "short-term price pressure and long-term price increases" suggests that processors have increased bargaining power over immediate grain supplies, but competition for subsequent supply has not eased. On Wednesday, the Midwest basis was stable to slightly weaker, with the Illinois Morris River terminal down 2 cents and the Nebraska Blair up, indicating a lack of consensus on a bearish outlook in the spot market. On the export front, South Korean importer Cargill Agri Purina tendered for up to 67,000 tons of feed corn on Tuesday, explicitly requiring only South American or South African origins—direct evidence that Asian buyers are systematically bypassing US grain sources amid a stronger dollar. On Wednesday, December-shipment corn CIF barges in the Gulf of Mexico were trading at a 95-cent premium to December futures, down 2 cents, with quotes at 97 cents down 3 cents, and some trades at 97-98 cents. The barge premium adjusted moderately with the futures market, but the channel remained unblocked. Ahead of Thursday's export sales report, analysts expect weekly corn sales to be between 1.2 million and 2 million tons. If the actual data falls in the upper half, funds' willingness to continue shorting near the late June lows will be dampened.Soybeans: Net selling of 9,500 lots, but the nature of the sale was a reduction in long positions, which is a fundamental difference from wheat and corn.
Soybeans fell only 0.71% on Wednesday, making them the most resilient of the three commodities. However, this resilience must be interpreted within the context of open interest. Data from FX678's post-market analysis on Wednesday showed a net sell of 9,500 contracts by funds, with the 3-day and 5-day averages being net sells of 4,333 and 4,000 contracts respectively. In contrast, the 20-day and 30-day averages showed net buys of 525 and 200 contracts respectively. This discrepancy in averages clearly indicates that the soybean sell-off was a recent retreat of existing long positions, rather than a trend-driven short-selling by funds. Market participants described Wednesday's trading as "still reducing long positions in soybeans," a completely different phenomenon from the "adding to short positions" in wheat and corn. The divergence in the spot market further supports this assessment. On Wednesday, the basis between river terminals in the Midwest and soybean processing plants remained stable to rose, as some crushing plants struggled to secure immediate soybean supplies while farmers were busy harvesting corn. The thread began on Tuesday: new soybeans continued to flood the supply chain, with no transactions in the spot railway soybean meal market throughout the week, resulting in a fast-paced crushing season and ample supply. However, by Wednesday, weather forecasts indicated rainfall for the following week, prompting farmers to focus on harvesting their final batch of corn before the rains. This slowed soybean deliveries, making it more difficult for crushing plants to procure soybeans in the spot market, thus strengthening the basis compared to seasonal norms. January soybean shipments from the Gulf of Mexico traded on Wednesday at a 114-cent premium to January futures, with prices unchanged. Ahead of Thursday's export sales report, analysts expected weekly soybean sales of 1 million to 2 million tons, with purchases from major Asian countries remaining a hidden support level for the market.Soybean meal: The only commodity with a net buying trend over the past 5 days; the basis is more honest than the market data.
Soybean meal is the most unique case in this set of position data. On Wednesday, funds net sold 2,000 contracts, but the recent 3-day and 5-day averages were both net buys of 1,833 contracts. The recent 10-day, 20-day, and 30-day averages also all fell within the net buy range. This means that soybean meal is the only one of the five commodities that is still held by funds with a net long position in the medium-term average. Wednesday's single-day net selling is more like profit-taking than a directional reversal. The market responded positively: December soybean meal closed up $4.80 at $334.60 per short ton on Monday, rose another $2.80 to $337.40 per short ton on Tuesday, and continued to rise $1.20 to $336.40 per short ton on Wednesday. The January contract closed at $334.60 per short ton on Wednesday, up $1.40. In an environment of a strong dollar, falling crude oil prices, and lower soybean prices, soybean meal has risen for three consecutive trading days. The driving force behind this counter-trend rise is not new positive factors on the demand side, but rather the structural tension in the crushing chain. Data from the National Oilseed Processors Association shows that U.S. domestic soybean crushings reached 234.191 million bushels in October, a 19.3% increase from September and a 2.9% increase year-over-year, setting a new monthly record and exceeding the average forecast of 225.428 million bushels from nine analysts. This record crushing should have suppressed the basis for soybean meal, but the actual trend was as follows: the basis remained stable on Monday with light trading; on Tuesday, it remained stable to mixed with no spot rail soybean meal transactions throughout the week; on Wednesday, the basis remained stable, and distributors explicitly stated that some crushing plants in the Midwest were experiencing difficulties procuring spot soybeans, making the basis level stronger than the seasonally normal level. The current concern regarding soybean meal is the asymmetry in direction: the stronger-than-seasonal basis indicates that the spot market does not expect a deep decline, but the futures market has already risen to around $336-337 per short ton. If subsequent crushing data confirms continued supply increases, the pressure from the basis transmission to the futures market will reappear. The key point of this logic is the window when farmers turn to selling soybeans after finishing their corn harvest.Soybean oil: Net selling of 11,500 lots, with a 5-day average net selling of 8,167 lots, pressured by both increased crushing volume and dragging down crude oil prices.
On Wednesday, soybean oil saw a net sell of 11,500 contracts by funds. The average net sell over the past 3 and 5 days was 7,833 and 8,167 contracts respectively, with the 5-day average higher than the 3-day average, indicating sustained and intensified selling pressure over the past week. This contrasts sharply with the average net buy of soybean meal. The pricing clues for soybean oil are clearly visible through two paths. The first is crude oil: Wednesday's decline in crude oil was explicitly cited as one of the sources of bearish sentiment in the grain and oilseed sector. Soybean oil, as a biofuel feedstock, is more sensitive to crude oil than soybean meal. The second is crushing: October crushing volume hit a record high, while soybean oil inventories rebounded from a near 12-year low. These two clues point to one conclusion—soybean oil supply has been replenished after the harvest season's increased crushing volume, easing the tightness of low inventories, while the decline in crude oil is weakening the marginal profit support for biodiesel demand. For readers who only trade futures, the structural signals within the soybean sector are therefore more worthy of tracking than unilateral directional signals. Soybeans are seeing reduced buying by funds, with the basis remaining stable to rising; soybean meal is experiencing a seasonally firm basis ratio, three consecutive days of price increases, and the average still showing net buying; soybean oil is facing increased net selling, a rebound from low inventory levels, and dragging down by crude oil. These three factors combined are causing the oil-to-meal ratio to oscillate towards a relatively stronger position for meal, but this oscillation hinges on continued tight spot soybean procurement. Once farmers finish harvesting corn and soybean deliveries resume, the basis support for meal will weaken, while oil inventory replenishment and crude oil pressure will remain, potentially leading to another fluctuation in the direction of the oil-to-meal ratio. Soybean oil plays a ballast role in this combination rather than being a market leader.Summarize
By comparing the average open interest of the five commodities in a single table, the directional divergence becomes immediately apparent: wheat saw a net sell of 4,667 contracts over the past 5 days, and corn saw a net sell of 7,167 contracts, indicating that funds actively increased their short positions in these commodities with the support of the US dollar; soybeans saw a net sell of 4,000 contracts over the past 5 days, but the 20-day and 30-day averages are still net buys, indicating that existing long positions are retreating rather than a trend reversal; soybean meal is the only commodity where the 3-day, 5-day, 10-day, 20-day, and 30-day averages all fall within the net buy range; soybean oil saw a net sell of 8,167 contracts over the past 5 days, with selling pressure continuing to intensify. This grouping suggests that Wednesday's decline was a rebalancing of positions under macroeconomic pressure, rather than a substantial deterioration in spot supply and demand—wheat's basis remained stable in the plains, and bidding was underway; corn's basis diverged but there were export transactions; soybean's basis remained stable to rise, and crushing plants' spot purchases were tight; soybean meal's basis was seasonally firm. Looking ahead, three key points need to be considered: whether the expected range of 1 million to 2 million tons of soybeans and 1.2 million to 2 million tons of corn will be achieved in Thursday's weekly export sales data; whether the US dollar will continue to strengthen at its 19-month high; and whether soybean deliveries will resume after the corn harvest. Given the divergence in fund positions, the relative resilience of soybeans and the passive pressure on wheat and corn are likely to continue until export data or the direction of the US dollar provide new directional evidence.- Risk Warning and Disclaimer
- The market involves risk, and trading may not be suitable for all investors. This article is for reference only and does not constitute personal investment advice, nor does it take into account certain users’ specific investment objectives, financial situation, or other needs. Any investment decisions made based on this information are at your own risk.