Crude oil: Economic growth concerns dragged oil prices down further, but the risk of US military action limited the downside.
2026-11-19 19:38:34
The recent oil price sell-off is increasingly driven by demand concerns rather than improved market expectations for supply prospects, coupled with the continued high tensions in the Middle East. For oil prices to decline further, it will likely require weaker economic data, a more hawkish stance from the Federal Reserve, or a widespread sell-off in the stock market to exert additional downward pressure.  Crude oil prices continued their decline yesterday, influenced by concerns about economic growth. The lack of new developments in the US-Iran situation suggests that growth concerns are likely the primary driver of the drop. In fact, tensions in the Middle East continue to escalate, with the risk of further conflict increasing. Reports indicate that Trump is considering a new round of strikes against Iran, while insisting that the US does not need external assistance and that blockades remain its most effective means. US officials have also warned that Iran is prepared for further escalation, while Israel is urging military action. Meanwhile, the conflict between Saudi Arabia and the Houthis continues, with both sides launching attacks yesterday. Saudi Arabia has also stated that it expects the fighting with the Houthis to continue beyond 2027. Overall, market expectations regarding crude oil supply remain unchanged; therefore, the recent decline in oil prices stems from the demand side. Even if the US-Iran situation remains unchanged, oil prices may still fall further; however, for the downtrend to continue, it often requires a larger drop in the stock market, a more hawkish stance from the Federal Reserve, or weaker economic data as a catalyst. Crude Oil Technical Analysis – Daily Chart
 From the daily chart, the US crude oil CFD (USOIL) is approaching the key 80.00 level. If the price touches this level, buying is expected; bulls can place stop-loss orders below this level and position for a rebound towards 110.00. Conversely, bears will increase their short positions if the price breaks below 80.00, with the next support level at 68.00. Crude Oil Technical Analysis – 4-Hour Chart
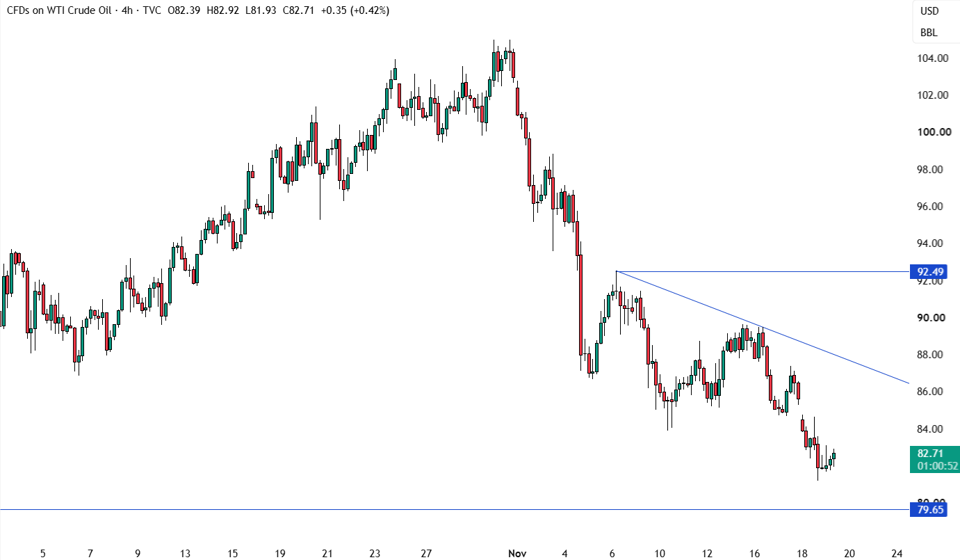 On the 4-hour chart, a downward trend line outlines the current bearish market structure. If oil prices rebound, bears will likely use this trend line as a base to establish positions, placing stop-loss orders above the trend line and betting on new lows. Bulls, on the other hand, will only enter long positions aggressively after seeing prices break above the trend line, with the first target at 92.50 and a further target of 110.00. Crude Oil Technical Analysis – 1-Hour Chart
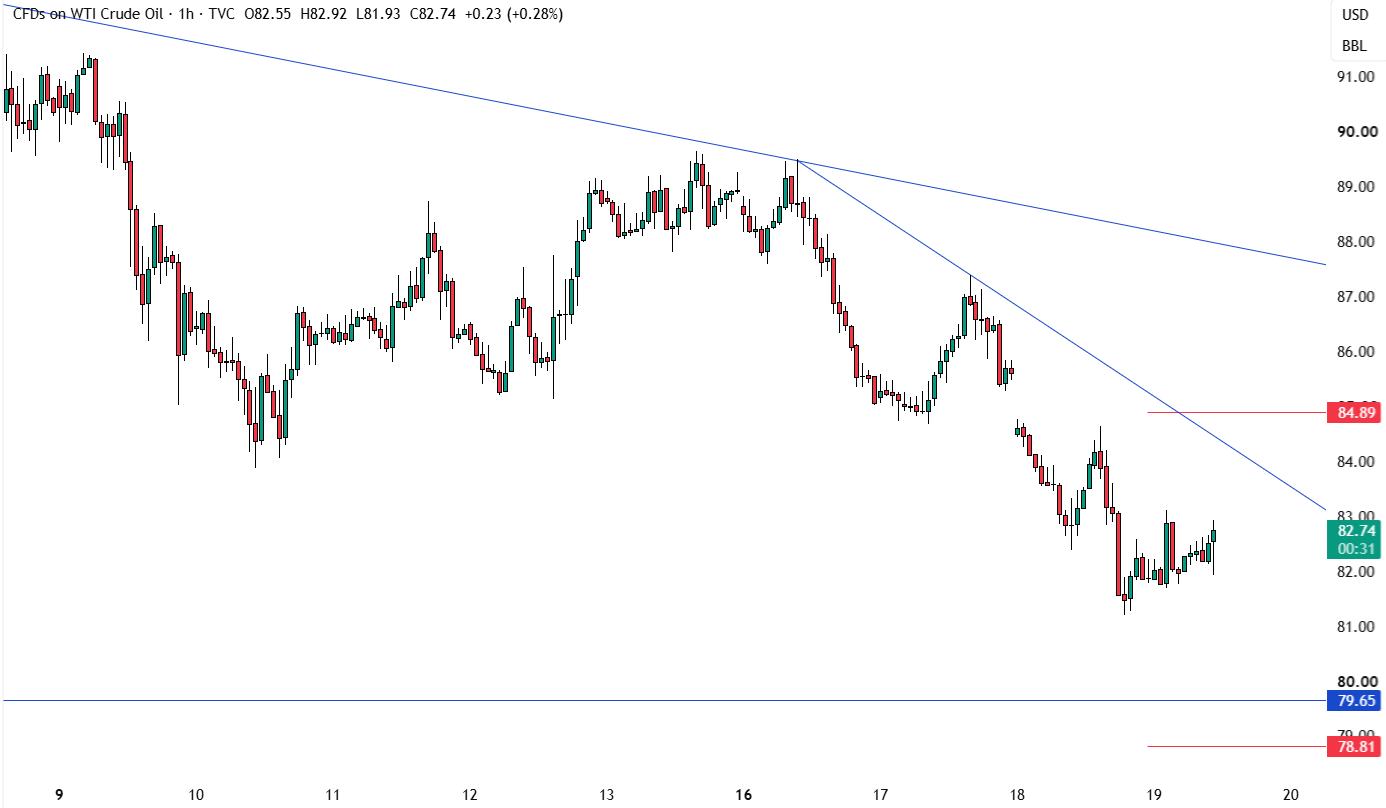 On the 1-hour chart, a secondary downtrend line represents the bearish momentum within this timeframe. Bears are likely to operate based on this trend line, placing stop-loss orders above it, continuously pushing oil prices to new lows. Bulls, on the other hand, await an upward breakout to extend the rebound to the next trend line. The red line in the chart represents today's average daily trading range (ADR). Upcoming Market Catalysts The latest US initial jobless claims data will be released later, but market focus will remain on the evolving US-Iran situation and global economic growth risks.
Crude oil prices continued their decline yesterday, influenced by concerns about economic growth. The lack of new developments in the US-Iran situation suggests that growth concerns are likely the primary driver of the drop. In fact, tensions in the Middle East continue to escalate, with the risk of further conflict increasing. Reports indicate that Trump is considering a new round of strikes against Iran, while insisting that the US does not need external assistance and that blockades remain its most effective means. US officials have also warned that Iran is prepared for further escalation, while Israel is urging military action. Meanwhile, the conflict between Saudi Arabia and the Houthis continues, with both sides launching attacks yesterday. Saudi Arabia has also stated that it expects the fighting with the Houthis to continue beyond 2027. Overall, market expectations regarding crude oil supply remain unchanged; therefore, the recent decline in oil prices stems from the demand side. Even if the US-Iran situation remains unchanged, oil prices may still fall further; however, for the downtrend to continue, it often requires a larger drop in the stock market, a more hawkish stance from the Federal Reserve, or weaker economic data as a catalyst. Crude Oil Technical Analysis – Daily Chart From the daily chart, the US crude oil CFD (USOIL) is approaching the key 80.00 level. If the price touches this level, buying is expected; bulls can place stop-loss orders below this level and position for a rebound towards 110.00. Conversely, bears will increase their short positions if the price breaks below 80.00, with the next support level at 68.00. Crude Oil Technical Analysis – 4-Hour Chart On the 4-hour chart, a downward trend line outlines the current bearish market structure. If oil prices rebound, bears will likely use this trend line as a base to establish positions, placing stop-loss orders above the trend line and betting on new lows. Bulls, on the other hand, will only enter long positions aggressively after seeing prices break above the trend line, with the first target at 92.50 and a further target of 110.00. Crude Oil Technical Analysis – 1-Hour Chart On the 1-hour chart, a secondary downtrend line represents the bearish momentum within this timeframe. Bears are likely to operate based on this trend line, placing stop-loss orders above it, continuously pushing oil prices to new lows. Bulls, on the other hand, await an upward breakout to extend the rebound to the next trend line. The red line in the chart represents today's average daily trading range (ADR). Upcoming Market Catalysts The latest US initial jobless claims data will be released later, but market focus will remain on the evolving US-Iran situation and global economic growth risks.
- Risk Warning and Disclaimer
- The market involves risk, and trading may not be suitable for all investors. This article is for reference only and does not constitute personal investment advice, nor does it take into account certain users’ specific investment objectives, financial situation, or other needs. Any investment decisions made based on this information are at your own risk.