Crude oil trading alert: Weakening demand expectations are putting downward pressure on oil prices, with US crude oil prices trending downwards.
2026-11-20 09:28:32
WTI crude oil traded around $82.75 in early Asian trading on Friday. WTI remained low as news of tanker disruptions in the Strait of Hormuz offset pressure from rising U.S. crude inventories and global oil glut forecasts. Compared to yesterday's $82.15, it rose slightly by about $0.60 today, but remains in a bearish structure below the 100-day moving average of $87.58.  The Iranian Navy said in a statement that two oil tankers struck mines and exploded in the Strait of Hormuz on Thursday. Meanwhile, Iranian-backed Houthi rebels also launched missiles at Riyadh, the Saudi capital. Saudi Civil Defense said on Thursday that an attack damaged several floors of Riyadh's tallest skyscraper—the headquarters of Saudi Arabia's sovereign wealth fund—as well as nearby buildings. U.S. crude oil inventories showed a much larger-than-expected increase last week, reinforcing expectations that global oil supply will exceed demand. According to the U.S. Energy Information Administration (EIA), crude oil inventories rose by 3.38 million barrels in the week ending November 13, compared with a decrease of 4.657 million barrels the previous week. Market consensus expected a decrease of 400,000 barrels . Deutsche Bank strategists noted that "concerns about economic demand have also driven a new decline in commodities," with Brent crude (-1.28%) falling to $91.95 per barrel , while gold ( -3.23% ) touched a 14-month low of $3,725 per ounce . They also noted that WTI crude oil ( -3.20% ) fell to $83.26 per barrel , highlighting the broad decline in the energy sector. Technically, WTI maintains its recent bearish tone on the daily chart, as it remains firmly below the 100-day simple moving average at $87.58 and the Bollinger Band middle line at approximately $91.63 . The price is near the lower end of its recent range, contrasting with a relatively low 14-day Relative Strength Index (RSI) of 34.40 , which suggests oversold conditions but is insufficient to offset downward pressure from the moving averages and the Bollinger Bands above. On the downside, initial support is located at the lower Bollinger Band at approximately $77.16 , where volatility may prompt an attempt to slow the decline. On the upside, immediate resistance is seen at the 100-day simple moving average at $87.58 , followed by the Bollinger Band middle line at approximately $91.63 ; a sustained rise above these levels is needed to alleviate the current bearish structure before a test of the upper Bollinger Band at approximately $106.09 is possible. The driving force behind suppressed oil prices has expanded from "oversupply" to " demand concerns ." Deutsche Bank explicitly attributes the widespread decline in commodities to "concerns about economic demand," pointing to "doubts about the AI investment boom" as the trigger. This explains why metals fell 5.30% in a single day, the largest drop since July 2025, and why corn and wheat also fell sharply. In other words, current pricing is not about "too much oil," but rather "potentially lower demand," and the two have different implications for oil prices: oversupply corresponds to a downward shift in the price range, while demand concerns may correspond to a trend revaluation. Another noteworthy point is the divergence between the magnitude of geopolitical escalation and market reactions: two oil tankers in Hormuz struck mines and exploded, Riyadh's tallest building was damaged, Houthi rebels launched missiles, and Western officials stated that Saudi Arabia is preparing for the conflict to extend into next year—the intensity of these events is significantly higher than before, yet Brent crude only rose 0.21% this morning. This indicates that the market currently prices geopolitical risks at a lower level than demand and inventory factors. If this attitude continues, oil prices will struggle to maintain a sustained risk premium; however, if a genuine disruption to flow occurs in the Hormuz region, the current low pricing could fuel a rebound.
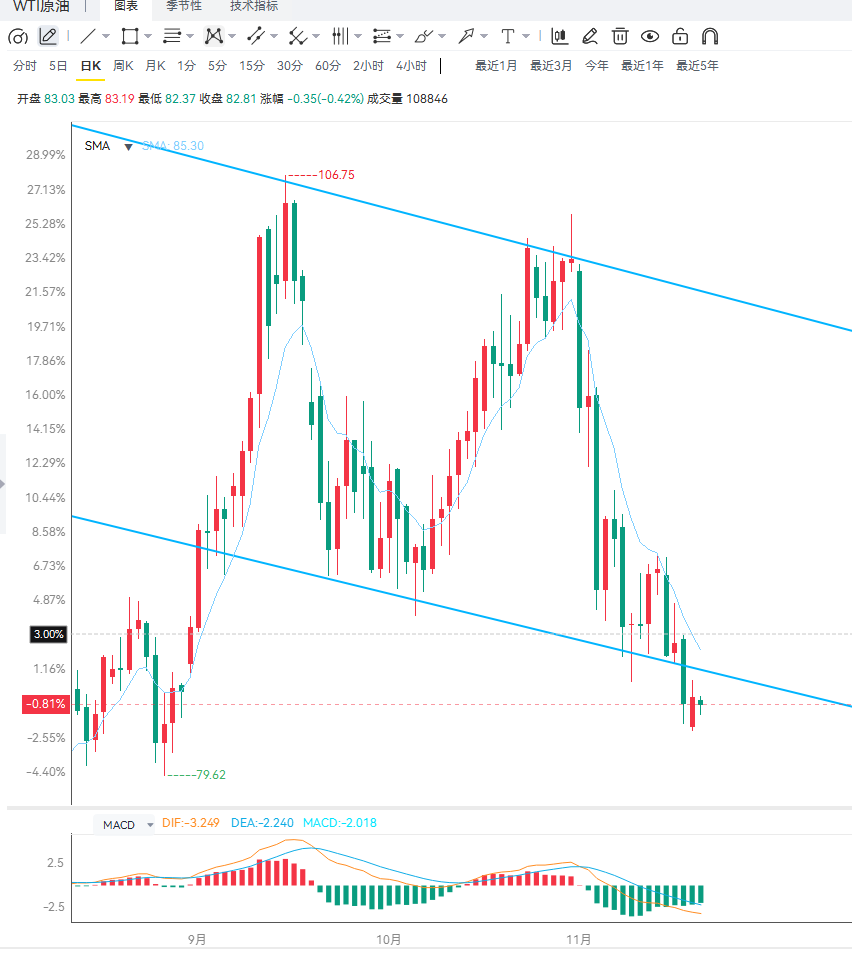 The editor summarizes that WTI is currently in a hedging pattern of "geopolitical escalation" and "demand concerns," with the latter's weight increasing. On the bullish side are real risks: two oil tankers in Hormuz struck mines and exploded, the Riyadh sovereign wealth fund headquarters building was damaged, Houthi missile attacks, and Saudi Arabia being accused of preparing for the conflict to extend into next year. On the bearish side is more structural: EIA inventories increased by 3.38 million barrels (expected to decrease by 400,000 barrels) , global surplus forecasts, and new demand concerns raised by Deutsche Bank; the latter, coupled with a 5.30% single-day drop in metals and a simultaneous sharp decline in corn and wheat, indicates a general decline in commodities. The resistance zone of 87.58-88.00 is the ceiling for any rebound, and the lower Bollinger Band at 77.16 is the next significant support level . In the medium term, if the narrative of "AI concerns → demand worries" continues to unfold, oil prices may fall below 77.16 and enter a downward trend. However, if there is a substantial disruption to shipping traffic around the Strait of Hormuz, or if Trump's decision to further target Iran materializes, the risk premium will be repriced, and oil prices are expected to rebound quickly to above 87.58. Key factors to watch include the actual extent of shipping disruptions around the Strait of Hormuz, subsequent EIA and API inventory data, demand-side data (especially AI capital expenditure and corporate investment intentions), OPEC+ policy in November, and further US actions against Iran.
The Iranian Navy said in a statement that two oil tankers struck mines and exploded in the Strait of Hormuz on Thursday. Meanwhile, Iranian-backed Houthi rebels also launched missiles at Riyadh, the Saudi capital. Saudi Civil Defense said on Thursday that an attack damaged several floors of Riyadh's tallest skyscraper—the headquarters of Saudi Arabia's sovereign wealth fund—as well as nearby buildings. U.S. crude oil inventories showed a much larger-than-expected increase last week, reinforcing expectations that global oil supply will exceed demand. According to the U.S. Energy Information Administration (EIA), crude oil inventories rose by 3.38 million barrels in the week ending November 13, compared with a decrease of 4.657 million barrels the previous week. Market consensus expected a decrease of 400,000 barrels . Deutsche Bank strategists noted that "concerns about economic demand have also driven a new decline in commodities," with Brent crude (-1.28%) falling to $91.95 per barrel , while gold ( -3.23% ) touched a 14-month low of $3,725 per ounce . They also noted that WTI crude oil ( -3.20% ) fell to $83.26 per barrel , highlighting the broad decline in the energy sector. Technically, WTI maintains its recent bearish tone on the daily chart, as it remains firmly below the 100-day simple moving average at $87.58 and the Bollinger Band middle line at approximately $91.63 . The price is near the lower end of its recent range, contrasting with a relatively low 14-day Relative Strength Index (RSI) of 34.40 , which suggests oversold conditions but is insufficient to offset downward pressure from the moving averages and the Bollinger Bands above. On the downside, initial support is located at the lower Bollinger Band at approximately $77.16 , where volatility may prompt an attempt to slow the decline. On the upside, immediate resistance is seen at the 100-day simple moving average at $87.58 , followed by the Bollinger Band middle line at approximately $91.63 ; a sustained rise above these levels is needed to alleviate the current bearish structure before a test of the upper Bollinger Band at approximately $106.09 is possible. The driving force behind suppressed oil prices has expanded from "oversupply" to " demand concerns ." Deutsche Bank explicitly attributes the widespread decline in commodities to "concerns about economic demand," pointing to "doubts about the AI investment boom" as the trigger. This explains why metals fell 5.30% in a single day, the largest drop since July 2025, and why corn and wheat also fell sharply. In other words, current pricing is not about "too much oil," but rather "potentially lower demand," and the two have different implications for oil prices: oversupply corresponds to a downward shift in the price range, while demand concerns may correspond to a trend revaluation. Another noteworthy point is the divergence between the magnitude of geopolitical escalation and market reactions: two oil tankers in Hormuz struck mines and exploded, Riyadh's tallest building was damaged, Houthi rebels launched missiles, and Western officials stated that Saudi Arabia is preparing for the conflict to extend into next year—the intensity of these events is significantly higher than before, yet Brent crude only rose 0.21% this morning. This indicates that the market currently prices geopolitical risks at a lower level than demand and inventory factors. If this attitude continues, oil prices will struggle to maintain a sustained risk premium; however, if a genuine disruption to flow occurs in the Hormuz region, the current low pricing could fuel a rebound. The editor summarizes that WTI is currently in a hedging pattern of "geopolitical escalation" and "demand concerns," with the latter's weight increasing. On the bullish side are real risks: two oil tankers in Hormuz struck mines and exploded, the Riyadh sovereign wealth fund headquarters building was damaged, Houthi missile attacks, and Saudi Arabia being accused of preparing for the conflict to extend into next year. On the bearish side is more structural: EIA inventories increased by 3.38 million barrels (expected to decrease by 400,000 barrels) , global surplus forecasts, and new demand concerns raised by Deutsche Bank; the latter, coupled with a 5.30% single-day drop in metals and a simultaneous sharp decline in corn and wheat, indicates a general decline in commodities. The resistance zone of 87.58-88.00 is the ceiling for any rebound, and the lower Bollinger Band at 77.16 is the next significant support level . In the medium term, if the narrative of "AI concerns → demand worries" continues to unfold, oil prices may fall below 77.16 and enter a downward trend. However, if there is a substantial disruption to shipping traffic around the Strait of Hormuz, or if Trump's decision to further target Iran materializes, the risk premium will be repriced, and oil prices are expected to rebound quickly to above 87.58. Key factors to watch include the actual extent of shipping disruptions around the Strait of Hormuz, subsequent EIA and API inventory data, demand-side data (especially AI capital expenditure and corporate investment intentions), OPEC+ policy in November, and further US actions against Iran.
- Risk Warning and Disclaimer
- The market involves risk, and trading may not be suitable for all investors. This article is for reference only and does not constitute personal investment advice, nor does it take into account certain users’ specific investment objectives, financial situation, or other needs. Any investment decisions made based on this information are at your own risk.