A rapid tightening of US financial conditions caused gold and silver to experience a historic plunge, with their sensitivity to the dollar reaching multi-decade lows.
2026-11-20 11:36:35
US financial conditions are tightening at an extremely rapid pace, leading to a sharp sell-off in gold and silver, with precious metals' sensitivity to the US dollar approaching multi-decade highs. Although occasional short-term rebounds occurred during the session, the overall technical pattern is weakening, and downside risks have not yet been eliminated. The pressure of tightening liquidity continues to weigh on the precious metals market. The trigger for this round of market movements was a reversal in sentiment in the technology sector caused by the listing of AI companies, putting pressure on risk assets across the board.
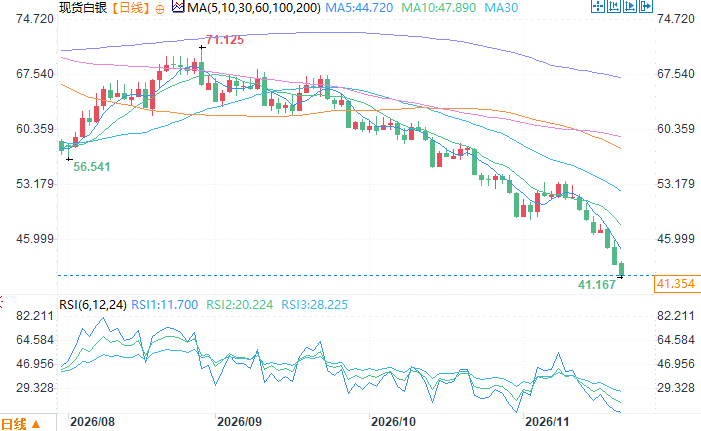 Spot silver daily chart source: FX678. As of 11:24 AM Beijing time on November 20th, spot silver was trading at $41.354 per ounce.
Financial conditions tightened at an unprecedented pace, causing gold and silver prices to fall to record lows.
Models replicating the Federal Reserve's FCI-G Financial Conditions Index show that while the overall financial environment remains loose, the pace of this easing is unusually rapid. The index has risen 0.487 points in the past 40 trading days. Since April 2009, only 2.6% of the same period has seen a similar level of tightening, with such periods mostly occurring during the early stages of the pandemic and major risk events such as the 2025 tariff announcement. Since September 22nd, gold has fallen by nearly 19%, and silver by nearly 38%, far exceeding the performance of the ten rapid tightening cycles since 2009. It is worth noting that gold's traditional safe-haven appeal has failed; gold mostly rose during the previous six tightening cycles, with the exception of April 2025. Silver is more commonly seen falling during tightening cycles, stemming from its stronger speculative nature and its link to industrial demand.The dollar's breakout intensified downward pressure, pushing gold and silver's elasticity to the dollar to extreme levels.
The US dollar broke through resistance this month, reaching its highest level since April 2025, while precious metals' sensitivity to the dollar has reached extreme levels. Looking back at daily data from over 50 years ago, the beta coefficient of gold against the US dollar index over 252 trading days was -2.54, meaning that for every 1% increase in the dollar index, gold roughly fell by 2.54%, a figure high since 1972. Silver's beta coefficient reached -5.62, indicating even greater volatility. Analysts believe that the dollar's continuous surge requires a period of consolidation, but as long as the Federal Reserve maintains a hawkish stance and US economic data does not show significant weakness, the dollar is unlikely to sustain a reversal, and precious metals will continue to face pressure.Gold has broken down across the board technically, with key support levels gradually approaching.
Gold had previously found support at the $4,000 level, but has now failed to hold that position, and has also failed to recover to the medium- and long-term moving averages, indicating a concentrated outflow of funds. Since November 10th, gold prices have fallen from $4,147 to around $3,625, a cumulative drop of over $500, breaking through multiple support levels. The next important level to watch is the 50% retracement level of the bull market from September 2022 to January 2026 at $3,607, with further support at $3,579 and the all-time high of $3,500 before April 2025. Currently, the 14-day RSI has fallen to around 26, and the MACD has confirmed a bearish signal, indicating strong downward momentum. Although there is a possibility of a short-term rebound due to short covering after the oversold condition, the short-term trend remains downward.Silver prices fell even more sharply, with the downtrend firmly in control.
Silver's decline has far exceeded that of gold, entering a deep bear market with prices significantly deviating from medium- and long-term moving averages. Silver failed to hold above $54.50 this month, breaching previous support at $48.65 and the Fibonacci level at $48.32, accelerating its decline to around $42.97. Key support levels below are the upward trendline around $41 and $39.53. While the silver RSI has not yet reached a new low, suggesting a slight slowdown in downward momentum, the MACD remains in a bearish structure. If a rebound occurs, $46.55, $48.32, and $48.65 will act as layers of resistance; until these levels are recovered, the bearish trend will remain intact.Conclusion
The recent plunge in gold and silver prices is not solely a result of a stronger US dollar; it reflects deeper pressures from rapidly tightening US financial conditions and a strained dollar liquidity. Precious metals' elasticity to the dollar is at historical lows, and the technical downtrend is clear. Although a short-term rebound may occur at any time after the oversold condition, the downward pressure on precious metals is unlikely to be completely eliminated until the Federal Reserve shifts its policy and the dollar weakens. Spot silver daily chart source: FX678. As of 11:24 AM Beijing time on November 20th, spot silver was trading at $41.354 per ounce.
- Risk Warning and Disclaimer
- The market involves risk, and trading may not be suitable for all investors. This article is for reference only and does not constitute personal investment advice, nor does it take into account certain users’ specific investment objectives, financial situation, or other needs. Any investment decisions made based on this information are at your own risk.