After eight drops in nine days, where is gold headed?
2026-11-20 18:18:30
Over the past nine trading days, international spot gold has recorded an extremely rare "eight-day decline," retreating sharply from its historical peak of $5,596.33 per ounce at the beginning of the year. This week, it even dipped to a low of $3,514.62 per ounce, with a cumulative pullback of over 37%.  As the one-sided decline evolves into a cold market inertia, the factors that supported the structural bull market in gold over the past two years—"continuous gold purchases by global central banks," "de-dollarization narrative," and "geopolitical safe-haven premium"—are being ignored by investors. Faced with panic, investors have completely abandoned their former bullish logic, and the sentiment in the gold market has been systematically damaged, undergoing a brutal shift from "faith-driven" to "liquidity stampede. " Macroeconomic Logic Reconstruction: From "Safe-Haven Totem" to "Liquidity ATM" Reviewing the market anomalies of the past two weeks, the core contradiction in the global financial market has shifted to the valuation bubble in the AI sector and the draining of cross-asset liquidity. With Anthropic's official listing on Nasdaq and the chain reaction triggered by Nvidia's Jensen Huang in the secondary market, Wall Street's rhetoric about "excessive AI capital expenditure and the bursting of the tech stock valuation bubble" has resurfaced. Against the backdrop of a sharp cooling of market risk appetite and concentrated selling of tech heavyweights by institutions, highly leveraged hedge funds and multi-asset allocation institutions are facing severe pressure from margin calls and risk control stop-loss orders. In such extreme liquidity crunches, gold, with its excellent liquidity and substantial accumulated profits, has not acted as a "safe haven" but has instead become a "cash cow" for institutions to repatriate dollar cash and cover losses in the equity market. Simultaneously, gold's safe-haven pricing power is being directly stripped away by dollar assets. Faced with market turmoil, global safe-haven funds have not flowed to non-interest-bearing precious metals but have instead poured into the dollar, which boasts high liquidity and risk-free coupon rates. The strong dollar index has created a direct substitution and competition relationship with gold in terms of safe-haven assets. Adding further pressure to bullish investors is the continued deterioration of the interest rate environment: the yield on 10-year US Treasury bonds remains firmly above 5.0%, and for gold, which does not generate any coupon, a risk-free benchmark interest rate above 5% constitutes an extremely rigid opportunity cost squeeze. Furthermore, with the Federal Reserve's policy expectations shifting significantly hawkish, the market's pricing of the probability and number of subsequent rate hikes is constantly being revised upwards. Hawkish statements from policymakers have become the norm in the market, and gold, highly sensitive to interest rates, naturally bears the brunt of the sell-off. Technical Analysis: Target Level Calculation After Breakout
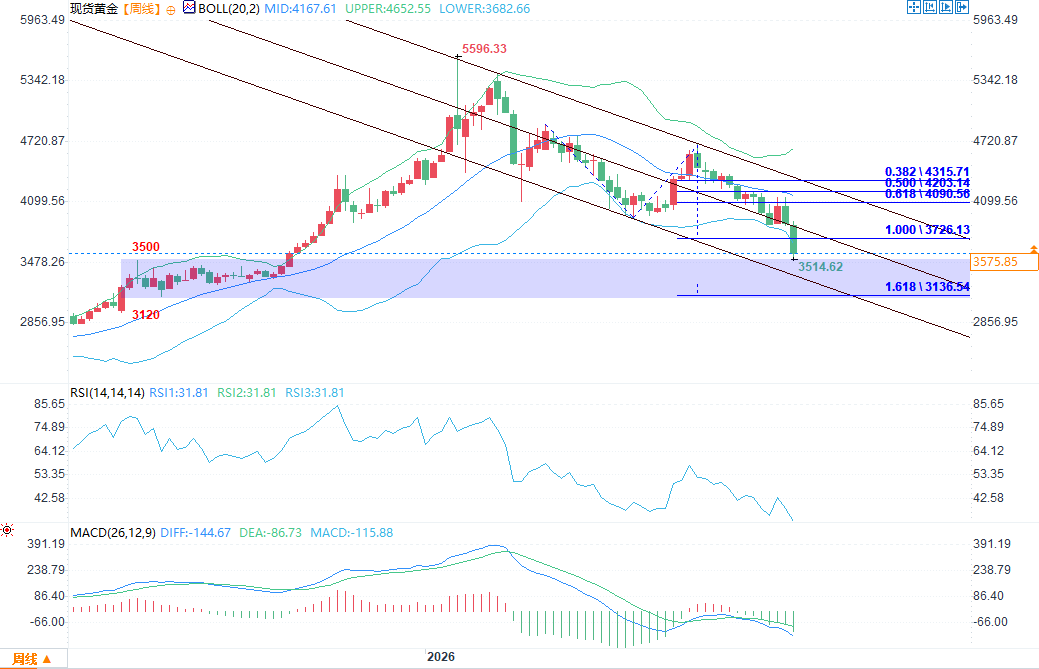 (Source of spot gold weekly chart: EasyTrade) If this panic evolves into an extreme stampede similar to the previous one-sided surge, where exactly will the decline end? Combining the technical pattern of the spot gold weekly chart, the bearish momentum is accelerating, and the market has completely turned from bullish to bearish. On the weekly chart, the gold price broke through the lower Bollinger Band (US$3680.12) with a large bearish candlestick. The MACD lines (DIFF -145.33, DEA -86.86) continued to diverge below the zero axis, and the green momentum bars continued to lengthen. The RSI (14) has fallen to the weak zone of 31.67. Although it is close to the oversold threshold of 30, under the dominance of one-sided panic, the indicator dulling often means the continuation of the main downward wave rather than the bottom. Using the Fibonacci retracement level to extend the downward trend since the high, gold prices broke through the key 0.382 ($4315.71), 0.500 ($4203.14), and 0.618 ($4090.56) retracement levels successively, and last week further broke through the 1.000 Fibonacci extension level ($3726.13), completely opening up downside potential. If this downward trend continues, the 1.618 Fibonacci extension level calculated by the Fibonacci retracement level points precisely to $3136.54. It is worth noting that reviewing the historical price movement from April to August 2025, gold prices formed a wide consolidation range lasting five months during this period, with its core area of concentrated trading volume located precisely in the $3120 to $3500 range. The $3136.54 calculated by the Fibonacci retracement level differs from the bottom of this historical range at $3120 by only a dozen dollars, forming a cross-cycle technical resonance. Market Outlook and Trading Strategy: Sell on Rallies Gold is currently trading around $3514.62, just shy of the psychologically important $3500 level. In this bearish market fueled by extreme sentiment, the $3500 level represents a significant accumulation of stop-loss orders from previous long positions and a resistance level for structured derivatives. A break below this level with substantial volume could easily trigger a chain reaction of selling by algorithmic traders, pushing gold prices rapidly towards the $3120-$3136 area for final support. Although the weekly RSI is approaching oversold territory after the recent sharp decline, potentially triggering a sharp, impulsive rebound due to short covering, investors must be aware that a new long-term upward trend for gold remains a long way off. Historically, the sole underlying logic for gold's medium- to long-term strength has been the downward trend in US real interest rates. While US Treasury real interest rates have slightly declined in the past two trading days, the magnitude is negligible and unlikely to shake the current high-interest-rate environment unless there is a fundamental reversal in the Fed's tightening expectations. Before a clear right-side reversal signal appears in the trend, avoid blindly buying the dip during a downtrend. Any rebound caused by oversold conditions should be regarded as another opportunity to short – especially when the gold price retraces to test the previous core support level of around $3,850, it will be a high-risk-reward point to short the trend.
As the one-sided decline evolves into a cold market inertia, the factors that supported the structural bull market in gold over the past two years—"continuous gold purchases by global central banks," "de-dollarization narrative," and "geopolitical safe-haven premium"—are being ignored by investors. Faced with panic, investors have completely abandoned their former bullish logic, and the sentiment in the gold market has been systematically damaged, undergoing a brutal shift from "faith-driven" to "liquidity stampede. " Macroeconomic Logic Reconstruction: From "Safe-Haven Totem" to "Liquidity ATM" Reviewing the market anomalies of the past two weeks, the core contradiction in the global financial market has shifted to the valuation bubble in the AI sector and the draining of cross-asset liquidity. With Anthropic's official listing on Nasdaq and the chain reaction triggered by Nvidia's Jensen Huang in the secondary market, Wall Street's rhetoric about "excessive AI capital expenditure and the bursting of the tech stock valuation bubble" has resurfaced. Against the backdrop of a sharp cooling of market risk appetite and concentrated selling of tech heavyweights by institutions, highly leveraged hedge funds and multi-asset allocation institutions are facing severe pressure from margin calls and risk control stop-loss orders. In such extreme liquidity crunches, gold, with its excellent liquidity and substantial accumulated profits, has not acted as a "safe haven" but has instead become a "cash cow" for institutions to repatriate dollar cash and cover losses in the equity market. Simultaneously, gold's safe-haven pricing power is being directly stripped away by dollar assets. Faced with market turmoil, global safe-haven funds have not flowed to non-interest-bearing precious metals but have instead poured into the dollar, which boasts high liquidity and risk-free coupon rates. The strong dollar index has created a direct substitution and competition relationship with gold in terms of safe-haven assets. Adding further pressure to bullish investors is the continued deterioration of the interest rate environment: the yield on 10-year US Treasury bonds remains firmly above 5.0%, and for gold, which does not generate any coupon, a risk-free benchmark interest rate above 5% constitutes an extremely rigid opportunity cost squeeze. Furthermore, with the Federal Reserve's policy expectations shifting significantly hawkish, the market's pricing of the probability and number of subsequent rate hikes is constantly being revised upwards. Hawkish statements from policymakers have become the norm in the market, and gold, highly sensitive to interest rates, naturally bears the brunt of the sell-off. Technical Analysis: Target Level Calculation After Breakout (Source of spot gold weekly chart: EasyTrade) If this panic evolves into an extreme stampede similar to the previous one-sided surge, where exactly will the decline end? Combining the technical pattern of the spot gold weekly chart, the bearish momentum is accelerating, and the market has completely turned from bullish to bearish. On the weekly chart, the gold price broke through the lower Bollinger Band (US$3680.12) with a large bearish candlestick. The MACD lines (DIFF -145.33, DEA -86.86) continued to diverge below the zero axis, and the green momentum bars continued to lengthen. The RSI (14) has fallen to the weak zone of 31.67. Although it is close to the oversold threshold of 30, under the dominance of one-sided panic, the indicator dulling often means the continuation of the main downward wave rather than the bottom. Using the Fibonacci retracement level to extend the downward trend since the high, gold prices broke through the key 0.382 ($4315.71), 0.500 ($4203.14), and 0.618 ($4090.56) retracement levels successively, and last week further broke through the 1.000 Fibonacci extension level ($3726.13), completely opening up downside potential. If this downward trend continues, the 1.618 Fibonacci extension level calculated by the Fibonacci retracement level points precisely to $3136.54. It is worth noting that reviewing the historical price movement from April to August 2025, gold prices formed a wide consolidation range lasting five months during this period, with its core area of concentrated trading volume located precisely in the $3120 to $3500 range. The $3136.54 calculated by the Fibonacci retracement level differs from the bottom of this historical range at $3120 by only a dozen dollars, forming a cross-cycle technical resonance. Market Outlook and Trading Strategy: Sell on Rallies Gold is currently trading around $3514.62, just shy of the psychologically important $3500 level. In this bearish market fueled by extreme sentiment, the $3500 level represents a significant accumulation of stop-loss orders from previous long positions and a resistance level for structured derivatives. A break below this level with substantial volume could easily trigger a chain reaction of selling by algorithmic traders, pushing gold prices rapidly towards the $3120-$3136 area for final support. Although the weekly RSI is approaching oversold territory after the recent sharp decline, potentially triggering a sharp, impulsive rebound due to short covering, investors must be aware that a new long-term upward trend for gold remains a long way off. Historically, the sole underlying logic for gold's medium- to long-term strength has been the downward trend in US real interest rates. While US Treasury real interest rates have slightly declined in the past two trading days, the magnitude is negligible and unlikely to shake the current high-interest-rate environment unless there is a fundamental reversal in the Fed's tightening expectations. Before a clear right-side reversal signal appears in the trend, avoid blindly buying the dip during a downtrend. Any rebound caused by oversold conditions should be regarded as another opportunity to short – especially when the gold price retraces to test the previous core support level of around $3,850, it will be a high-risk-reward point to short the trend.
- Risk Warning and Disclaimer
- The market involves risk, and trading may not be suitable for all investors. This article is for reference only and does not constitute personal investment advice, nor does it take into account certain users’ specific investment objectives, financial situation, or other needs. Any investment decisions made based on this information are at your own risk.