Gold Price Forecast: Gold Prices to Fall Towards Stronger Support Zone
2026-11-20 19:12:36
On Friday (November 20), spot gold came under renewed pressure during the European session, continuing its decline this week. This sell-off has prompted traders to look for potential entry points for buyers, but I believe that simply testing a previous swing low is unlikely to be enough to stop this downward trend.  Looking back at the surge in gold prices towards the all-time high of January 29th in late 2025, spot gold has quickly surpassed many of the levels currently being tested. Buyers were on a buying spree driven by fear of missing out. In my view, that rally was largely driven by momentum and speculation, while the real heavy buying is likely located in areas far below the breakout levels. This is equally important in a downtrend. Small swing bottoms formed during an uptrend, consisting of only one or two candlesticks, might trigger a rebound, but they don't necessarily represent areas where buyers spent enough time building a bottom. I wouldn't assume every such level would be sufficient to provide support and push the market higher. I believe a major bottom is more likely to form from an event that changes traders' expectations, followed by a chart pattern indicating buyers' willingness to enter. Events like next week's options expiration might create a temporary bottom, but that doesn't mean it will end a larger downtrend. Larger events like the Fed explicitly ending rate hikes might provide the best bullish signal. However, until then, we may already be in a "sell on rallies" phase—if not yet. A starting point for finding long-term value is $2,801.11, roughly 50% of the all-time high. From there, I would trace back up the charts to identify key support zones that might attract buyers before prices reach that level. This isn't to say gold necessarily has to fall to $2,801.11, but rather that I would continue to monitor this level while waiting for events and patterns that could signal a shift in momentum. The Fed's Role as a Catalyst Looking back at 2025, gold began its more dramatic rise after the September monetary policy meeting. Certain elements of that meeting, or the Fed's statement, sowed the seeds for at least two more rate cuts, but speculators pushed it further, at one point anticipating as many as three rate cuts by 2026. However, these ideas came to an abrupt halt the day after the January meeting—gold hit an all-time high of $5,602.23. Within three days, the price of gold fell by 20%. According to classic technical analysis, this means gold has reversed from a bull market to a bear market. Throughout the year, spot gold fluctuated repeatedly, but the common feature on the chart was that higher highs and lower lows were consistently occurring. This movement essentially followed a gradual retracement of market expectations for a Fed rate cut, until August 25th, when sellers became convinced the Fed would raise rates in September—and the Fed did. The Fed held rates steady in October, but this wasn't enough to trigger a rebound, essentially only slowing the decline. In early November, a higher-than-expected CPI report intensified selling pressure again. Previously, traders had pushed prices to $4,148.71 on November 9th, creating a bull trap. The market is now in near freefall, and it seems nothing can stop this sell-off except for a series of minor bottoms in 2025. Gold Price Forecast In my view, the market will continue to weaken until it reaches a price area that has historically been visited and supported by large buyers. Those minor bottoms formed during the uptrend are insufficient to halt this decline. Daily Technical Analysis
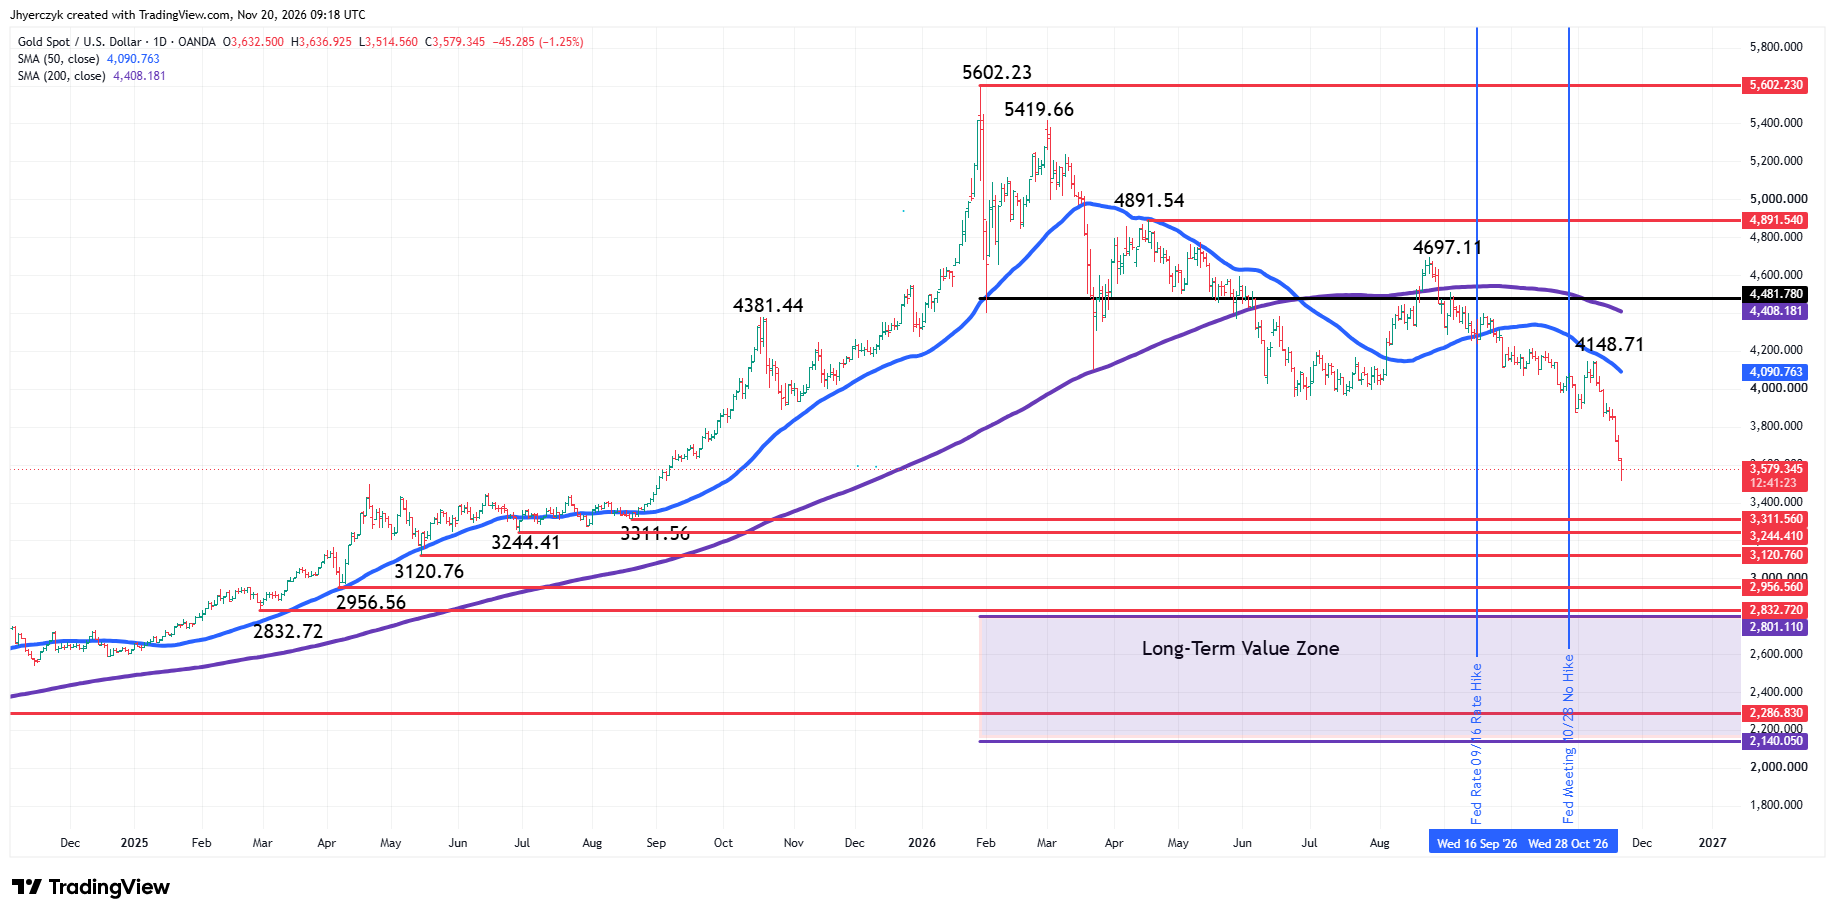 Spot gold fell sharply in early trading on Friday, extending the steep decline that began on Thursday, November 12th – with sellers breaking below the swing low of $3,870.32 from Friday, October 30th. The next downside targets are a series of major bottoms in 2025, from $3,311.56 on August 20th to $2,832.72 on February 28th. This current pullback could target any of these levels, but the most solid and effective swing lows are $3,120.76, $2,956.56, and $2,832.72. The market is currently within the major upward wave from $3,311.56 to $4,381.44 in 2025. As can be seen on the chart, this upward movement has had very few waves, with the few that have occurred lasting only one or two days. This suggests that traders were not passively placing buy orders, but actively sweeping up sell orders. This typically means there aren't many large buyers, as they usually don't chase highs—their size is enough to stop the decline. What we're seeing in this area is likely a lot of aggressive speculative buying, which is one reason the market was able to easily break through this area. Value zones—areas where heavyweight buyers might be present—are more likely to attract new funds, which is why I think the intensity of the sell-off might begin to slow in the $3,311.56 to $2,832.72 range. In other words, more serious buyers are likely to emerge in this range. What to Watch At the open today, my bias was downward, with $3,311.56 being my first key target. Given the length of this decline in both price and time, I'm fully aware that the market is within the timeframe for a potential daily closing price reversal bottoming pattern to form, and this pattern could be quite dramatic. If I see this pattern forming on the daily chart, my bearish bias will weaken; if the pattern is confirmed, I might turn bullish to capitalize on a potential counter-trend rally.
Looking back at the surge in gold prices towards the all-time high of January 29th in late 2025, spot gold has quickly surpassed many of the levels currently being tested. Buyers were on a buying spree driven by fear of missing out. In my view, that rally was largely driven by momentum and speculation, while the real heavy buying is likely located in areas far below the breakout levels. This is equally important in a downtrend. Small swing bottoms formed during an uptrend, consisting of only one or two candlesticks, might trigger a rebound, but they don't necessarily represent areas where buyers spent enough time building a bottom. I wouldn't assume every such level would be sufficient to provide support and push the market higher. I believe a major bottom is more likely to form from an event that changes traders' expectations, followed by a chart pattern indicating buyers' willingness to enter. Events like next week's options expiration might create a temporary bottom, but that doesn't mean it will end a larger downtrend. Larger events like the Fed explicitly ending rate hikes might provide the best bullish signal. However, until then, we may already be in a "sell on rallies" phase—if not yet. A starting point for finding long-term value is $2,801.11, roughly 50% of the all-time high. From there, I would trace back up the charts to identify key support zones that might attract buyers before prices reach that level. This isn't to say gold necessarily has to fall to $2,801.11, but rather that I would continue to monitor this level while waiting for events and patterns that could signal a shift in momentum. The Fed's Role as a Catalyst Looking back at 2025, gold began its more dramatic rise after the September monetary policy meeting. Certain elements of that meeting, or the Fed's statement, sowed the seeds for at least two more rate cuts, but speculators pushed it further, at one point anticipating as many as three rate cuts by 2026. However, these ideas came to an abrupt halt the day after the January meeting—gold hit an all-time high of $5,602.23. Within three days, the price of gold fell by 20%. According to classic technical analysis, this means gold has reversed from a bull market to a bear market. Throughout the year, spot gold fluctuated repeatedly, but the common feature on the chart was that higher highs and lower lows were consistently occurring. This movement essentially followed a gradual retracement of market expectations for a Fed rate cut, until August 25th, when sellers became convinced the Fed would raise rates in September—and the Fed did. The Fed held rates steady in October, but this wasn't enough to trigger a rebound, essentially only slowing the decline. In early November, a higher-than-expected CPI report intensified selling pressure again. Previously, traders had pushed prices to $4,148.71 on November 9th, creating a bull trap. The market is now in near freefall, and it seems nothing can stop this sell-off except for a series of minor bottoms in 2025. Gold Price Forecast In my view, the market will continue to weaken until it reaches a price area that has historically been visited and supported by large buyers. Those minor bottoms formed during the uptrend are insufficient to halt this decline. Daily Technical Analysis Spot gold fell sharply in early trading on Friday, extending the steep decline that began on Thursday, November 12th – with sellers breaking below the swing low of $3,870.32 from Friday, October 30th. The next downside targets are a series of major bottoms in 2025, from $3,311.56 on August 20th to $2,832.72 on February 28th. This current pullback could target any of these levels, but the most solid and effective swing lows are $3,120.76, $2,956.56, and $2,832.72. The market is currently within the major upward wave from $3,311.56 to $4,381.44 in 2025. As can be seen on the chart, this upward movement has had very few waves, with the few that have occurred lasting only one or two days. This suggests that traders were not passively placing buy orders, but actively sweeping up sell orders. This typically means there aren't many large buyers, as they usually don't chase highs—their size is enough to stop the decline. What we're seeing in this area is likely a lot of aggressive speculative buying, which is one reason the market was able to easily break through this area. Value zones—areas where heavyweight buyers might be present—are more likely to attract new funds, which is why I think the intensity of the sell-off might begin to slow in the $3,311.56 to $2,832.72 range. In other words, more serious buyers are likely to emerge in this range. What to Watch At the open today, my bias was downward, with $3,311.56 being my first key target. Given the length of this decline in both price and time, I'm fully aware that the market is within the timeframe for a potential daily closing price reversal bottoming pattern to form, and this pattern could be quite dramatic. If I see this pattern forming on the daily chart, my bearish bias will weaken; if the pattern is confirmed, I might turn bullish to capitalize on a potential counter-trend rally.
- Risk Warning and Disclaimer
- The market involves risk, and trading may not be suitable for all investors. This article is for reference only and does not constitute personal investment advice, nor does it take into account certain users’ specific investment objectives, financial situation, or other needs. Any investment decisions made based on this information are at your own risk.