Crude oil analysis: WTI crude oil fell more than 1% during the session, OPEC's optimistic expectations were intertwined with inventory and tariff pressures
2025-07-16 20:17:38
Oil prices have become more volatile this week amid rising global trade tensions and geopolitical risks. Previously, oil prices fell to a four-year low of around $60 per barrel in April and May due to U.S. tariff threats and OPEC+ production increases, but have recently rebounded to above $70 due to escalating conflicts in the Middle East and improved demand expectations. The market is focused on today's (July 16) U.S. Energy Information Administration (EIA) inventory data and progress in global trade negotiations.

Fundamental analysis
OPEC's optimistic expectations and demand support
In its July monthly report, OPEC raised its forecast for global crude oil demand growth in 2025, predicting an increase of 1.3 million barrels per day in 2026 to 1.28 million barrels per day, down 150,000 barrels per day from the previous month, but still higher than the International Energy Agency's (IEA) forecast of 1.05 million barrels per day.
OPEC pointed out that the economic resilience of China, India and Brazil, as well as the stabilization of the US and European economies, are the main drivers of demand growth. In particular, China's state-owned refineries have increased processing capacity after maintenance to meet summer fuel demand and replenish low inventories, easing market selling pressure. Reuters quoted analysts as saying that China will import 51 million barrels of crude oil from Saudi Arabia in August, the largest amount in more than two years, showing signs of demand recovery.
Inventory pressure and US market dynamics
However, rising inventories in the United States have curbed the rise in oil prices. The latest data from the American Petroleum Institute (API) showed that crude oil inventories increased by 839,000 barrels, gasoline inventories increased by 1.93 million barrels, and distillate inventories increased by 828,000 barrels last week, indicating ample supply. Traders are looking forward to today's official EIA report, which may provide support for oil prices if it shows that crude oil inventories have decreased by 1.8 million barrels as expected. The IEA report showed that global oil inventories surged by 73.9 million barrels to 7.818 billion barrels in May, with China's crude oil inventories increasing by 82 million barrels and US natural gas liquids inventories increasing by 79 million barrels, masking the trend of declining inventories in other regions. High inventory levels and OPEC+'s plan to increase production (550,000 barrels/day in August) have caused market concerns about oversupply.
Global trade and geopolitical risks
Global trade tensions have exacerbated oil price volatility. President Trump has threatened to impose a 30% tariff on EU goods starting August 1 and warned of severe sanctions on Russia if an agreement on Ukraine is not reached within 50 days. The EU plans to retaliate against $84 billion worth of US goods, which could further weigh on global fuel demand.
JPMorgan Chase warned that a comprehensive 10% tariff could push Brent oil prices to as low as $60 a barrel in 2026. At the same time, the Kurdistan region of Iraq suspended production at some oil fields due to drone attacks, but the market reacted calmly because the losses were controllable and there were no casualties.
Goldman Sachs pointed out that if Iran's exports of 1 million barrels per day are interrupted due to geopolitical conflicts, Brent oil prices may briefly rise to $90 per barrel, but OPEC+'s high spare capacity will limit the gains.
Institutional Views
JPMorgan Chase: Brent oil prices are expected to average $66 per barrel in 2025 and fall to $58 per barrel in 2026 due to supply growth and weak demand in non-OPEC+ countries (such as the United States and Brazil).
Goldman Sachs: Brent oil prices are forecast to be in the range of $70-85 per barrel in 2025, with an average price of $76 per barrel, affected by increased non-OPEC+ supply and geopolitical risks. If tariffs are fully implemented, oil prices may fall to a low of $60 per barrel in 2026.
ING: Brent price is expected to average USD 71 per barrel in 2025 and will be under further pressure in 2026 due to oversupply. We recommend paying attention to China's inventory dynamics and OPEC+ compliance.
Technical Analysis
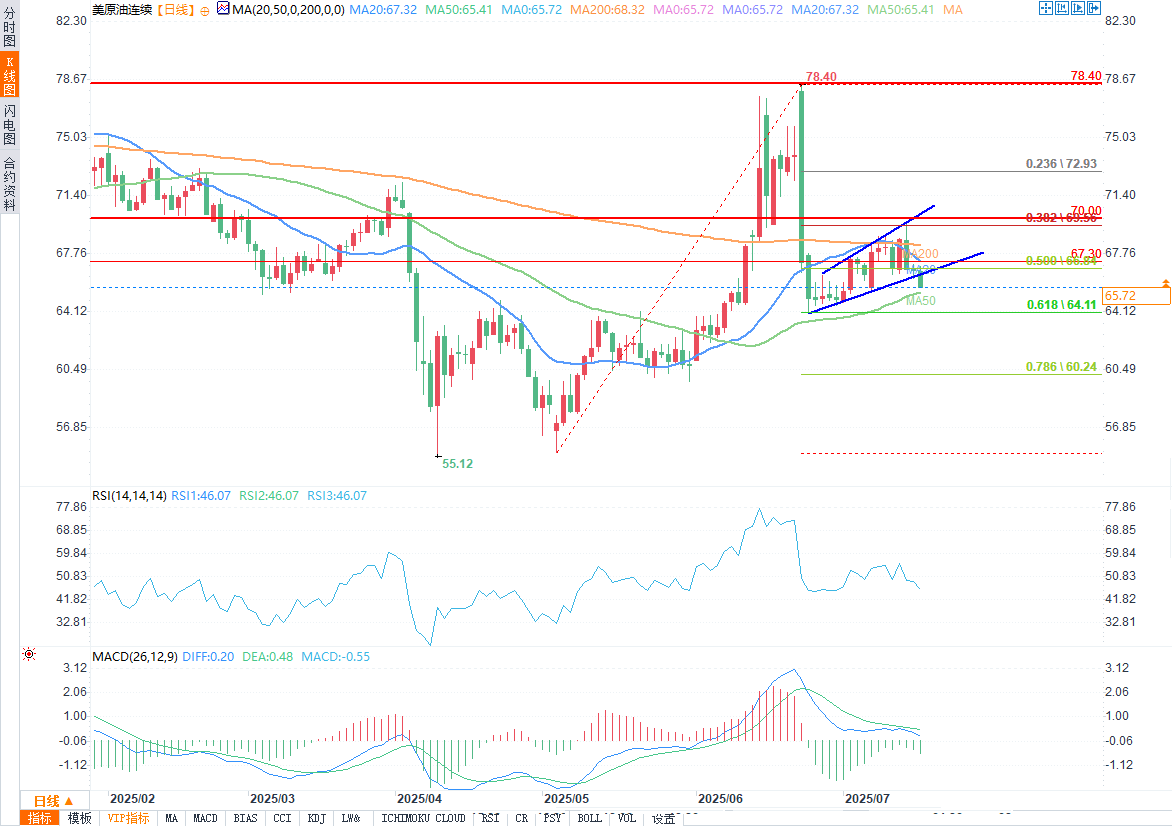
WTI prices have experienced an upward phase before and are currently in a relatively volatile period. Bulls and bears are playing a game at the current price, and the direction is unclear for the time being.

(WTI crude oil daily chart source: Yihuitong)
The current RSI value of the relative strength index (RSI) is about 46.71, fluctuating around 50, which means that the long and short forces are temporarily balanced, and the market lacks clear unilateral trend guidance. The moving average convergence and divergence (MACD) DIF line value is 0.22, the DEA line value is 0.48, the MACD bar is -0.52, and the DIF line is below the DEA line, indicating that the short force has the upper hand in the short term and the market is in a weak pattern.
Support
Fibonacci retracement line: On the daily chart, the 0.618 position corresponds to 64.12, and the 0.5 position corresponds to 66.84. These positions are important reference levels. When the price falls close to it, it is easy to trigger buying support based on market psychology and trading habits. The daily MA50 value is around 65.62-65.94, which has played a supporting role many times in the past price decline process and is an important support reference line under the medium-term trend.
Resistance
Fibonacci retracement line: 0.236 corresponds to 72.96, 0.382 is close to the 70 USD mark. When the price rises to this point, due to the market's expectations of the key price, selling pressure is likely to hinder the upward movement. The current value of the MA20 moving average is about 67.33. If it goes down, it will suppress the price when it rises.
The previous high point near 78.40 is a strong resistance level, where a large number of locked-in orders accumulate, and when the price approaches it will face heavy selling pressure.
If the price can break through the resistance near 78.40 with large volume, it is expected to start a new round of rise; if it falls below important support such as the MA50 moving average or the rising trend line, it may trigger further decline.
- Risk Warning and Disclaimer
- The market involves risk, and trading may not be suitable for all investors. This article is for reference only and does not constitute personal investment advice, nor does it take into account certain users’ specific investment objectives, financial situation, or other needs. Any investment decisions made based on this information are at your own risk.


