The stabilization of the US dollar has suppressed safe-haven demand. How long can gold prices last in the short term?
2025-07-28 21:45:33
On Monday (July 28), spot gold maintained a weak and volatile pattern. The gold price in the North American session was about $3,325 per ounce, and it was generally operating in a narrow range. On the news front, the United States and the European Union reached a trade agreement to deepen market access in the fields of digital services, agriculture and clean energy, which led to the stabilization and recovery of the US dollar, boosted the sentiment of the equity market, and significantly restored the market risk appetite, weakening the attractiveness of safe-haven assets. At the same time, the expectation of the Federal Reserve's interest rate cut has cooled marginally, and the trend of precious metals has continued to be under pressure.

The market is currently focusing on the impact of easing trade policies. The new agreement announced by the United States and the European Union significantly reduced the tariff base to 15%, far lower than the previously threatened 30%, in exchange for the EU's openness in digital services, agriculture and key minerals. This result not only avoids unnecessary tariff confrontation, but also lays the foundation for future multilateral cooperation.
The agreement is seen as a replica of the US-Japan trade agreement, with the core aim of unifying industrial standards and enhancing bilateral trust. More notably, the agreement also establishes a key mineral cooperation mechanism, allowing EU companies to enjoy the US subsidy clause in the Inflation Reduction Act. Analysts believe that this will undoubtedly build support for the US dollar, further weakening the safe-haven property of gold.
On the other hand, CME FedWatch data showed that market expectations for the Fed's September rate cut are cooling, with a probability of 59.5%, and 38.9% of the market still betting on keeping interest rates unchanged. The previously released FOMC meeting minutes showed that most members remained cautious about inflation and expressed reservations about rapid easing, which suppressed the possibility of further strengthening of gold.
In addition, the outlook for global trade negotiations remains highly uncertain. If they fail to proceed smoothly, they may reignite inflation concerns and provide a potential catalyst for gold's rebound. However, analysts believe that in terms of current market sentiment, bulls lack effective support.
From the 4-hour K-line chart, the current gold price is running near the lower track of the Bollinger Band, and the Bollinger Band channel is clearly open, indicating that short-term volatility continues to expand. Recently, the gold price has fallen rapidly from the high of $3438.80, forming a typical short-term downward trend structure.
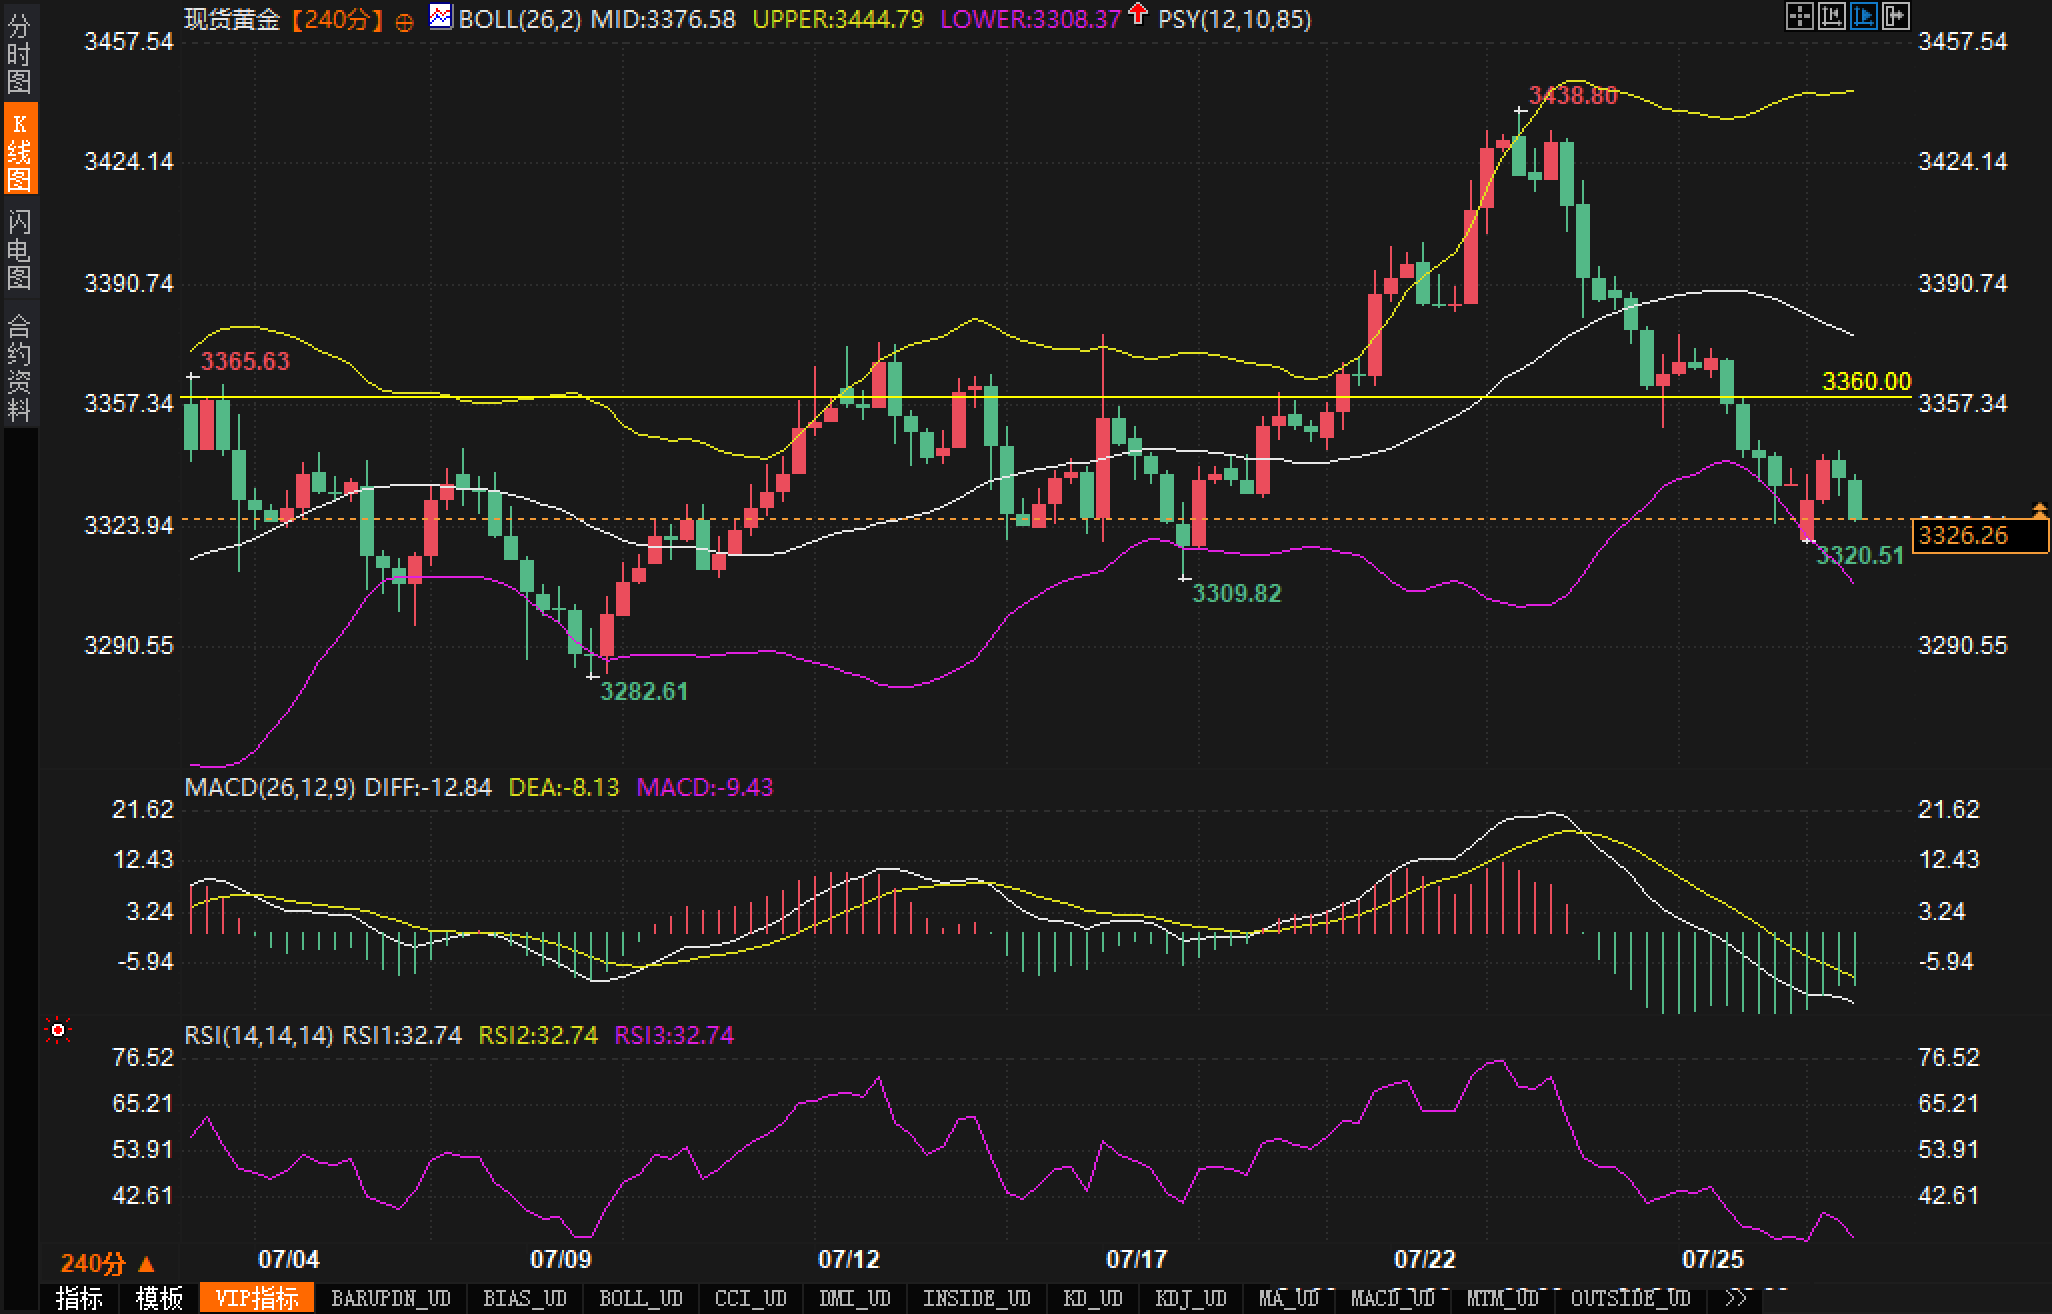
The price has effectively fallen below the previous low support of $3360.00 and continues to run between the middle and lower rails. The lower low has been refreshed to $3320.51, indicating that the short-term correction trend is not over yet. The lower Bollinger band is currently around $3308.37, becoming the focus of short-term support observation. Analysts believe that if this price is lost, the probability of further testing the low of $3282.61 will increase significantly.
In terms of MACD indicators, the fast and slow lines continue to decline. Although the short-selling columnar momentum shows signs of convergence, it has not yet formed an effective golden cross and is still in a dead cross state. The MACD value is -9.43, indicating that the short-selling trend has not yet exhausted, and we still need to be vigilant about the risk of inertial decline in the short term.
The RSI indicator is running at the edge of oversold area, and the current value is 32.74. Although there is no clear reversal signal, it has been hovering at a low level for a long time, and there is a possibility of a technical rebound. However, if it cannot quickly return to above 50, gold still has room to fall.
Based on the above analysis, the technical side shows that the downward trend of gold still dominates the market. If the short-term rebound cannot break through the upper resistance of $3,360, it will be regarded as a weak pullback.
The current market sentiment has gradually shifted from the previous risk aversion preference to the risk asset allocation tendency. On the one hand, the agreement between the United States and the European Union has eased the market's concerns about trade policy uncertainty and enhanced the attractiveness of the equity market; on the other hand, the dollar has stabilized and rebounded due to fundamentals, further suppressing the demand for gold.
From the perspective of funds, short-term liquidity is still relatively abundant, but the rising risk appetite has weakened gold's status as a "safe haven for funds". Technical indicators such as MACD and RSI have not shown reversal signals, indicating that bulls lack confidence and market consensus is tilted downward. Although panic selling has not occurred, sentiment is clearly bearish.
However, considering that gold is on the verge of technical oversold, some traders may consider a short-term technical rebound. Coupled with the uncertainty about the subsequent progress of global trade, there are still potential reflexive variables in the market.
Bullish Outlook:
Analysts believe that if the subsequent global trade negotiations encounter unexpected twists and turns, or the Federal Reserve releases dovish signals again, inflation concerns and risk aversion will be re-stimulated, and gold is expected to gain support and rebound. Once the price rises above $3,360 and stabilizes the middle Bollinger Band, the rebound target may point to the $3,390-3,400 range. At the same time, if the US dollar index weakens, gold may get a double boost.
Bearish Outlook:
Analysts believe that if the gold price fails to break through the resistance of $3,360, the bears will continue to dominate. If the lower track of the Bollinger Band at $3,308 is breached, it will open up further downward space, with important support areas of $3,280 and $3,250. In addition, if the Fed maintains its current hawkish tendency and the dollar continues to strengthen, the pressure on gold will continue to increase, or enter a new round of downward cycle.
Fundamentals:
The market is currently focusing on the impact of easing trade policies. The new agreement announced by the United States and the European Union significantly reduced the tariff base to 15%, far lower than the previously threatened 30%, in exchange for the EU's openness in digital services, agriculture and key minerals. This result not only avoids unnecessary tariff confrontation, but also lays the foundation for future multilateral cooperation.
The agreement is seen as a replica of the US-Japan trade agreement, with the core aim of unifying industrial standards and enhancing bilateral trust. More notably, the agreement also establishes a key mineral cooperation mechanism, allowing EU companies to enjoy the US subsidy clause in the Inflation Reduction Act. Analysts believe that this will undoubtedly build support for the US dollar, further weakening the safe-haven property of gold.
On the other hand, CME FedWatch data showed that market expectations for the Fed's September rate cut are cooling, with a probability of 59.5%, and 38.9% of the market still betting on keeping interest rates unchanged. The previously released FOMC meeting minutes showed that most members remained cautious about inflation and expressed reservations about rapid easing, which suppressed the possibility of further strengthening of gold.
In addition, the outlook for global trade negotiations remains highly uncertain. If they fail to proceed smoothly, they may reignite inflation concerns and provide a potential catalyst for gold's rebound. However, analysts believe that in terms of current market sentiment, bulls lack effective support.
Technical aspects:
From the 4-hour K-line chart, the current gold price is running near the lower track of the Bollinger Band, and the Bollinger Band channel is clearly open, indicating that short-term volatility continues to expand. Recently, the gold price has fallen rapidly from the high of $3438.80, forming a typical short-term downward trend structure.
The price has effectively fallen below the previous low support of $3360.00 and continues to run between the middle and lower rails. The lower low has been refreshed to $3320.51, indicating that the short-term correction trend is not over yet. The lower Bollinger band is currently around $3308.37, becoming the focus of short-term support observation. Analysts believe that if this price is lost, the probability of further testing the low of $3282.61 will increase significantly.
In terms of MACD indicators, the fast and slow lines continue to decline. Although the short-selling columnar momentum shows signs of convergence, it has not yet formed an effective golden cross and is still in a dead cross state. The MACD value is -9.43, indicating that the short-selling trend has not yet exhausted, and we still need to be vigilant about the risk of inertial decline in the short term.
The RSI indicator is running at the edge of oversold area, and the current value is 32.74. Although there is no clear reversal signal, it has been hovering at a low level for a long time, and there is a possibility of a technical rebound. However, if it cannot quickly return to above 50, gold still has room to fall.
Based on the above analysis, the technical side shows that the downward trend of gold still dominates the market. If the short-term rebound cannot break through the upper resistance of $3,360, it will be regarded as a weak pullback.
Market sentiment observation:
The current market sentiment has gradually shifted from the previous risk aversion preference to the risk asset allocation tendency. On the one hand, the agreement between the United States and the European Union has eased the market's concerns about trade policy uncertainty and enhanced the attractiveness of the equity market; on the other hand, the dollar has stabilized and rebounded due to fundamentals, further suppressing the demand for gold.
From the perspective of funds, short-term liquidity is still relatively abundant, but the rising risk appetite has weakened gold's status as a "safe haven for funds". Technical indicators such as MACD and RSI have not shown reversal signals, indicating that bulls lack confidence and market consensus is tilted downward. Although panic selling has not occurred, sentiment is clearly bearish.
However, considering that gold is on the verge of technical oversold, some traders may consider a short-term technical rebound. Coupled with the uncertainty about the subsequent progress of global trade, there are still potential reflexive variables in the market.
Outlook for the future:
Bullish Outlook:
Analysts believe that if the subsequent global trade negotiations encounter unexpected twists and turns, or the Federal Reserve releases dovish signals again, inflation concerns and risk aversion will be re-stimulated, and gold is expected to gain support and rebound. Once the price rises above $3,360 and stabilizes the middle Bollinger Band, the rebound target may point to the $3,390-3,400 range. At the same time, if the US dollar index weakens, gold may get a double boost.
Bearish Outlook:
Analysts believe that if the gold price fails to break through the resistance of $3,360, the bears will continue to dominate. If the lower track of the Bollinger Band at $3,308 is breached, it will open up further downward space, with important support areas of $3,280 and $3,250. In addition, if the Fed maintains its current hawkish tendency and the dollar continues to strengthen, the pressure on gold will continue to increase, or enter a new round of downward cycle.
- Risk Warning and Disclaimer
- The market involves risk, and trading may not be suitable for all investors. This article is for reference only and does not constitute personal investment advice, nor does it take into account certain users’ specific investment objectives, financial situation, or other needs. Any investment decisions made based on this information are at your own risk.