Trump slaps Canada with a 35% tariff, sending the Canadian dollar plummeting for six days to a two-month low.
2025-08-01 14:14:32
During the Asian session on Friday (August 1st), the USD/CAD pair surged and then retreated, reaching a new high since May 22nd at 1.3869. It is currently trading slightly lower at around 1.3850, after six consecutive days of gains. US President Donald Trump's unexpected increase in Canadian tariffs to 35%, coupled with hawkish comments from the Federal Reserve, drove the USD/CAD pair higher. Canada's S&P/TSX Composite Index closed down 0.4% on Thursday at 27,259.78, maintaining its upward trend.
On Thursday (July 31st), Trump unexpectedly raised tariffs on Canadian goods to 35%, making headlines. The White House stated in a statement that the increase was "in response to Canada's continued inaction and retaliatory actions," adding that the President "determined that this increase in tariffs is necessary to effectively address the current emergency." However, the move had little impact on the Canadian dollar, which had already strengthened due to the Federal Reserve's hawkish rhetoric.
Jerome Powell's hawkish tone earlier this week and solid US data have continued to strengthen the US dollar, and USD/CAD momentum continues to rise ahead of Friday's jobs report, which may determine whether the pair tests 1.3900.
Trump raises tariffs on Canada
Trump unexpectedly raised Canada's tariff rate from 25% to 35%, with the new rate taking effect on August 1.
The move, implemented under emergency powers, blames Canada's "continued inaction and retaliation" in responding to what the Trump administration has described as a worsening fentanyl crisis. While goods covered by the USMCA will remain duty-free, the White House said products transshipped to circumvent tariffs will face a 40% tariff.
The White House pointed to record seizures of fentanyl at "super labs" in western Canada and across the northern border, saying Ottawa has "failed to arrest drug traffickers, seize illicit drugs, and cooperate with U.S. law enforcement."
Trump initially imposed 25% tariffs in February but said further action was "necessary and appropriate" after Canada failed to respond.
In an official statement, the White House said "Canada has had ample opportunity to act," pledging to hold Ottawa accountable while putting U.S. national security "first."
Fed rate cut expectations slashed, strong data boosted the dollar
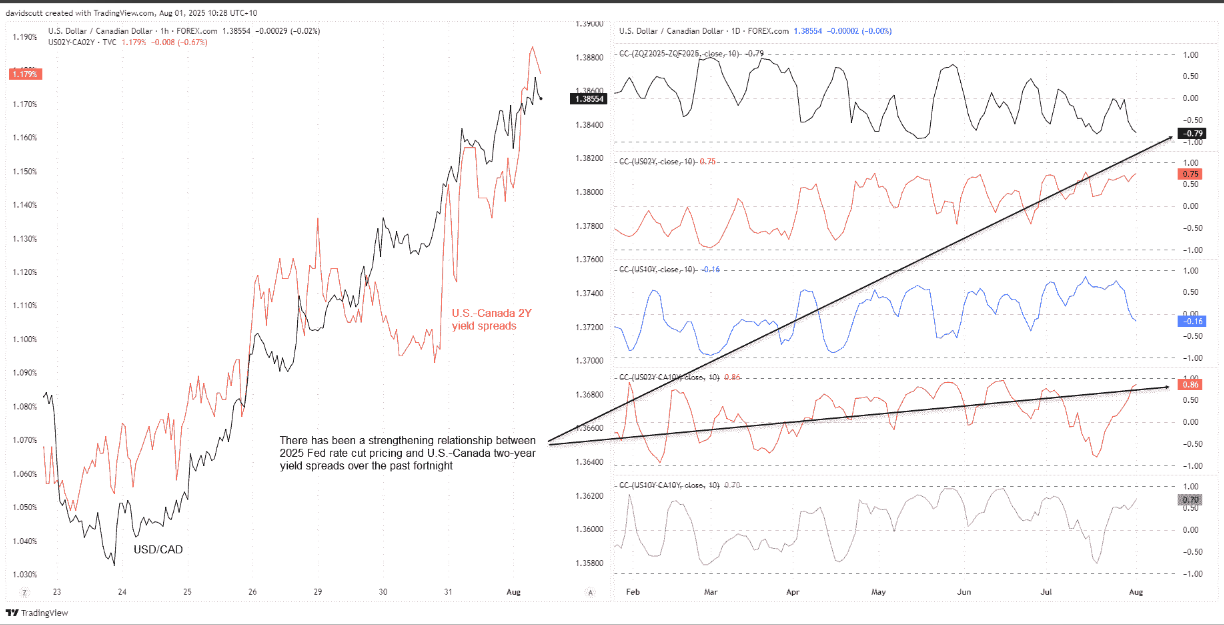
The Fed's move partly reflects the impact of U.S. import tariffs on the outlook for economic growth and inflation in the United States and Canada. The recent interest rate differential has favored the U.S. dollar, contributing to the rebound of the U.S. dollar against the Canadian dollar over the past two weeks.
The chart below compares the 2025 Federal Reserve benchmark interest rate curve with the difference in two-year Treasury yields between the United States and Canada, showing a relatively strong negative correlation: -0.79 and 0.86, respectively.
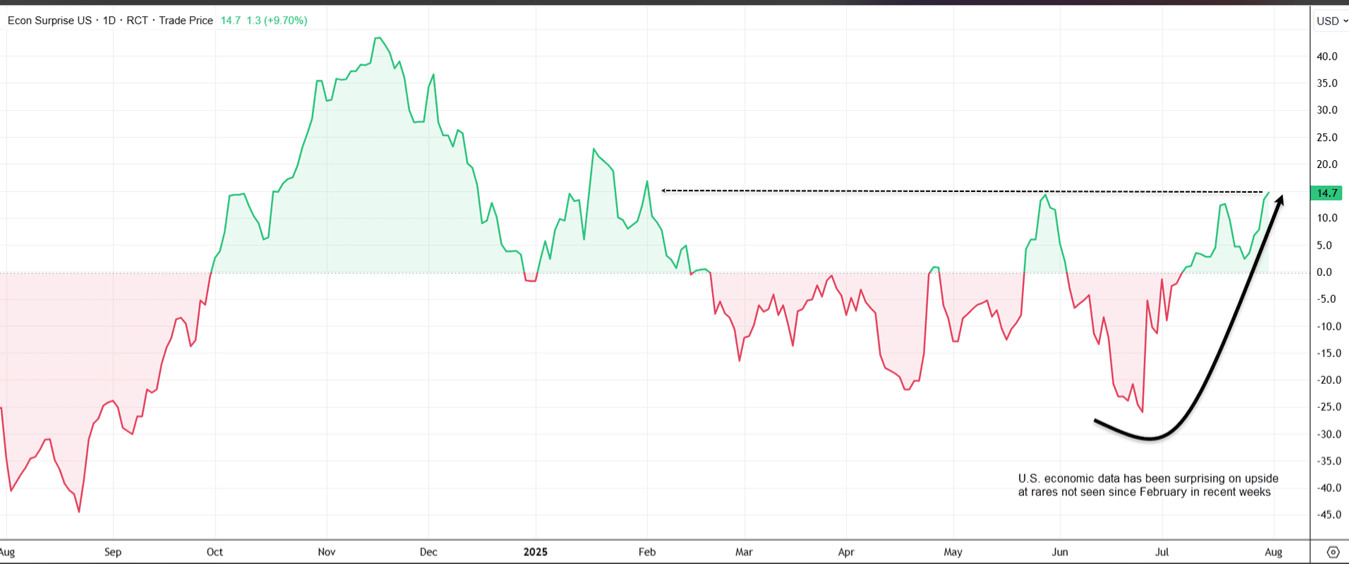
U.S. data has been impressive over the past month, with the Citigroup Economic Surprise Index (CESI) rising to its highest level since February. This indicator tracks how data performs relative to expectations, placing more weight on recent data to provide insight into short-term trends.
A reading of 14.7 indicates that recent data has exceeded expectations more than missed them, leading to a sharp reversal in the market's pricing of Federal Reserve rate cuts this year.
Before the release of the July non-farm payroll report on Friday, market pricing indicated that the Federal Reserve would cut interest rates by just 29 basis points, the smallest amount since February. Although the year is already halfway through and August has arrived, the resilience of US economic activity has far exceeded expectations, even in the face of tariff uncertainty. This has led to the market's expected rate cuts for this year being slashed by more than half in July.
Markets now price in a full rate cut in December, with the probability of a cut next month now below 50% - a significant shift from expectations just a few days ago.
While expectations are strengthening that the Federal Reserve will not cut interest rates until 2025, that outlook could change significantly if the non-farm payrolls report released later on Friday is weak.
The unemployment rate is the key data point to watch, as it is the Fed's most closely watched indicator. Markets expect the unemployment rate to rise by 0.1 percentage point to 4.2%, recovering half of the unexpected drop in June. Non-farm payrolls are expected to increase by 110,000, down from the previous 147,000.
While the market tends to react initially to the non-farm payrolls, if there is a divergence between that number and the unemployment rate, it may be the latter that ultimately drives the market.
Technical analysis: USD/CAD favors buying on dips
The Morning Star pattern that completed after last Thursday's rally provided an excellent signal for this week's trend, with USD/CAD surging from below 1.3600 to above 1.3800, breaking through horizontal resistance at 1.3650 and 1.3750, as well as the 50-day EMA.
With the RSI (14) moving higher and the MACD crossing above the signal line into positive territory, the momentum remains bullish and we prefer to buy on dips and secondary breakouts.
The 1.3900 resistance is the first hurdle that the bulls need to break through. After breaking through, they will target the resistance near the April 3 low of 1.4023 and the 200-day moving average of 1.4047.
On the downside, the neckline of the triple bottom at 1.3750 is the key point and an important support for the callback caused by profit-taking before the employment report.
There may also be buying below 1.3800.
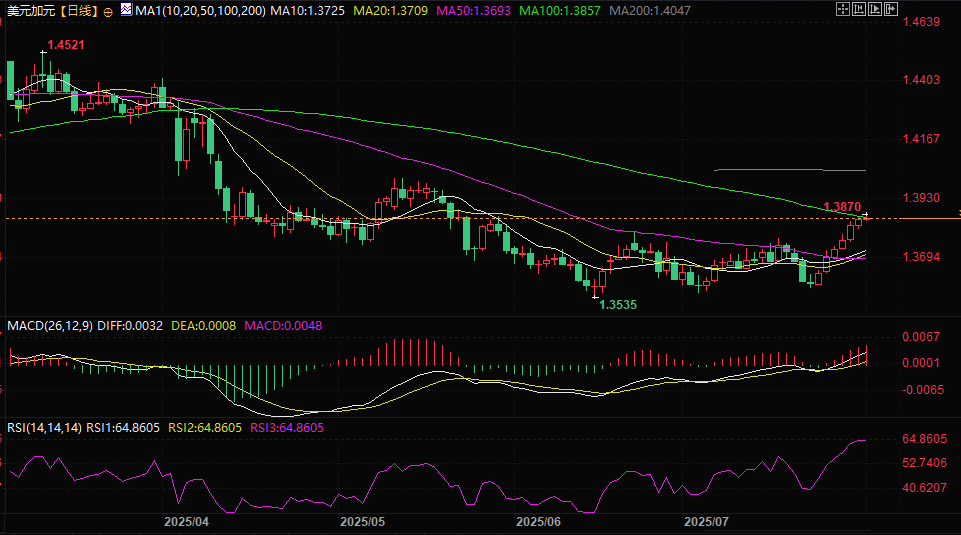
(USD/CAD daily chart, source: Yihuitong)
At 14:12 Beijing time, the current exchange rate of USD/CAD is: 1.3852/54.
On Thursday (July 31st), Trump unexpectedly raised tariffs on Canadian goods to 35%, making headlines. The White House stated in a statement that the increase was "in response to Canada's continued inaction and retaliatory actions," adding that the President "determined that this increase in tariffs is necessary to effectively address the current emergency." However, the move had little impact on the Canadian dollar, which had already strengthened due to the Federal Reserve's hawkish rhetoric.
Jerome Powell's hawkish tone earlier this week and solid US data have continued to strengthen the US dollar, and USD/CAD momentum continues to rise ahead of Friday's jobs report, which may determine whether the pair tests 1.3900.
Trump raises tariffs on Canada
Trump unexpectedly raised Canada's tariff rate from 25% to 35%, with the new rate taking effect on August 1.
The move, implemented under emergency powers, blames Canada's "continued inaction and retaliation" in responding to what the Trump administration has described as a worsening fentanyl crisis. While goods covered by the USMCA will remain duty-free, the White House said products transshipped to circumvent tariffs will face a 40% tariff.
The White House pointed to record seizures of fentanyl at "super labs" in western Canada and across the northern border, saying Ottawa has "failed to arrest drug traffickers, seize illicit drugs, and cooperate with U.S. law enforcement."
Trump initially imposed 25% tariffs in February but said further action was "necessary and appropriate" after Canada failed to respond.
In an official statement, the White House said "Canada has had ample opportunity to act," pledging to hold Ottawa accountable while putting U.S. national security "first."
Fed rate cut expectations slashed, strong data boosted the dollar
The Fed's move partly reflects the impact of U.S. import tariffs on the outlook for economic growth and inflation in the United States and Canada. The recent interest rate differential has favored the U.S. dollar, contributing to the rebound of the U.S. dollar against the Canadian dollar over the past two weeks.
The chart below compares the 2025 Federal Reserve benchmark interest rate curve with the difference in two-year Treasury yields between the United States and Canada, showing a relatively strong negative correlation: -0.79 and 0.86, respectively.
U.S. data has been impressive over the past month, with the Citigroup Economic Surprise Index (CESI) rising to its highest level since February. This indicator tracks how data performs relative to expectations, placing more weight on recent data to provide insight into short-term trends.
A reading of 14.7 indicates that recent data has exceeded expectations more than missed them, leading to a sharp reversal in the market's pricing of Federal Reserve rate cuts this year.
Before the release of the July non-farm payroll report on Friday, market pricing indicated that the Federal Reserve would cut interest rates by just 29 basis points, the smallest amount since February. Although the year is already halfway through and August has arrived, the resilience of US economic activity has far exceeded expectations, even in the face of tariff uncertainty. This has led to the market's expected rate cuts for this year being slashed by more than half in July.
Markets now price in a full rate cut in December, with the probability of a cut next month now below 50% - a significant shift from expectations just a few days ago.
While expectations are strengthening that the Federal Reserve will not cut interest rates until 2025, that outlook could change significantly if the non-farm payrolls report released later on Friday is weak.
The unemployment rate is the key data point to watch, as it is the Fed's most closely watched indicator. Markets expect the unemployment rate to rise by 0.1 percentage point to 4.2%, recovering half of the unexpected drop in June. Non-farm payrolls are expected to increase by 110,000, down from the previous 147,000.
While the market tends to react initially to the non-farm payrolls, if there is a divergence between that number and the unemployment rate, it may be the latter that ultimately drives the market.
Technical analysis: USD/CAD favors buying on dips
The Morning Star pattern that completed after last Thursday's rally provided an excellent signal for this week's trend, with USD/CAD surging from below 1.3600 to above 1.3800, breaking through horizontal resistance at 1.3650 and 1.3750, as well as the 50-day EMA.
With the RSI (14) moving higher and the MACD crossing above the signal line into positive territory, the momentum remains bullish and we prefer to buy on dips and secondary breakouts.
The 1.3900 resistance is the first hurdle that the bulls need to break through. After breaking through, they will target the resistance near the April 3 low of 1.4023 and the 200-day moving average of 1.4047.
On the downside, the neckline of the triple bottom at 1.3750 is the key point and an important support for the callback caused by profit-taking before the employment report.
There may also be buying below 1.3800.
(USD/CAD daily chart, source: Yihuitong)
At 14:12 Beijing time, the current exchange rate of USD/CAD is: 1.3852/54.
- Risk Warning and Disclaimer
- The market involves risk, and trading may not be suitable for all investors. This article is for reference only and does not constitute personal investment advice, nor does it take into account certain users’ specific investment objectives, financial situation, or other needs. Any investment decisions made based on this information are at your own risk.