Alert! Gold's 50-day moving average "moat" has been breached, and a fatal market reversal is brewing after the triangle breaks!
2025-08-05 20:16:38
On Tuesday (August 5), gold (XAU/USD) showed signs of weakness after hitting a two-week high on Monday. Market sentiment generally favored risk-on sentiment, with global stock markets rebounding strongly and US Treasury yields slightly rising, temporarily dampening gold's safe-haven appeal. Nevertheless, high expectations for a September Fed rate cut (market pricing suggests a 92% probability), coupled with the restrained performance of the US dollar index and US Treasury yields, provided downward support for gold prices, limiting their decline. The market is closely monitoring trade-related news and US economic data, with gold prices fluctuating narrowly around $3,350, and its short-term direction remains uncertain.

From a fundamental perspective, gold's recent price action is driven by multiple factors. First, rising expectations for a September Federal Reserve rate cut have become a key factor supporting gold prices. Last Friday's US non-farm payroll data, which fell short of expectations and saw a significant downward revision to the previous reading, fueled market concerns about an economic slowdown and pushed US Treasury yields lower. The 10-year Treasury yield hit a one-month low of 4.19% on Monday before recovering slightly to 4.21% on Tuesday, while the 30-year yield edged up from 4.78% to 4.80%. The US dollar index (DXY), after falling to a one-week low on Monday, stabilized around 99.00 on Tuesday, but remained capped by its recent high of 100.26. Heightened expectations for a rate cut have reduced the upside potential for the US dollar and US Treasury yields, indirectly providing support for gold.
Regarding market sentiment, a rebound in global stock markets weakened gold's safe-haven appeal. The MSCI World Index snapped a six-day losing streak, while the Asia-Pacific Index rose 0.6%. Japan's Nikkei 225 rose 280 points on Tuesday, while Europe's STOXX 50 and STOXX 600 indices both rose approximately 0.4%. The UK's FTSE 100 approached its all-time high of 9,150 points. The three major US stock indices performed particularly strongly on Monday, with the S&P 500 rising 1.5%, the Dow Jones Industrial Average soaring 585 points, and the Nasdaq Composite Index rising 1.9%. The rebound in risk appetite has led investors to pursue higher-yielding assets, temporarily reducing gold's appeal.
Furthermore, trade-related news has become a focal point for the market. Trump's tariff rhetoric has sparked concerns about the uncertainty of the global trade environment. While the specific impact remains unclear, the potential rise in geopolitical and trade risks provides potential support for gold's safe-haven properties. The ongoing tensions between Russia and Ukraine, as well as other geopolitical uncertainties, have also, to a certain extent, reinforced gold's position as a safe-haven asset.
On the data front, today's US economic calendar is relatively quiet. Key releases include the ISM Services PMI, the S&P Global Composite and Services PMI, the Goods and Services Trade Balance, and Redbook Retail Sales. While not blockbuster, these figures may provide further clues to the market regarding consumption, services activity, and external trade. Weak data could further reinforce expectations of a rate cut, positive for gold. Conversely, an unexpectedly strong reading could push up US Treasury yields and the US dollar, putting pressure on gold prices in the short term.
Notably, a recent report from a leading institution indicates that global gold demand reached 2,384 tons in the first half of 2025, the strongest six-month performance since 2013. Investment demand surged, with net inflows of 397 tons into gold ETFs and a 38-ton increase in retail investment demand to 636 tons, offsetting an 18% year-on-year decline in jewelry demand (782 tons). Although central bank gold purchases slowed to 415 tons compared to last year, full-year purchases are expected to remain high at 900-950 tons in 2025, providing long-term support for gold prices. Statements from Federal Reserve officials also offer market clues. San Francisco Fed President Mary Daly stated in a recent interview that the labor market is slowing but has not yet reached "dangerous" levels. She emphasized that the Fed will not postpone policy adjustments indefinitely, but remained cautious about the need for a September rate cut. The market interpreted this as continued expectations for a rate cut, but the pace may be more moderate.
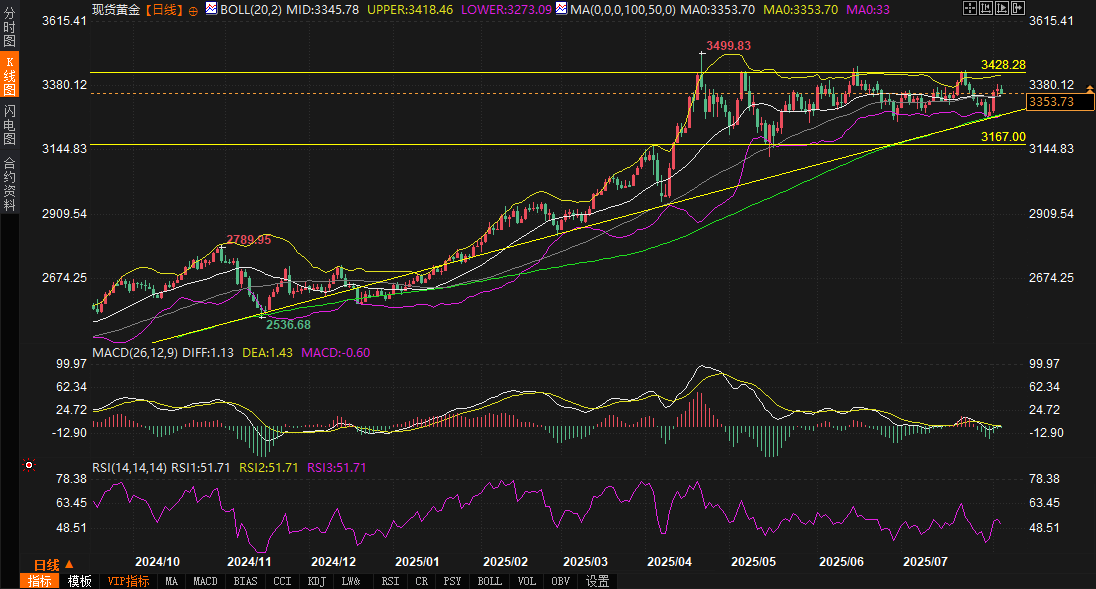
From a technical perspective, gold prices are consolidating after hitting a two-week high. The daily chart shows the current price at $3,351.31 per ounce, slightly above the 50-day moving average of $3,344.20 per ounce, and still some distance from the 100-day moving average of $3,278.19 per ounce. Last week, gold prices broke below an ascending triangle pattern and briefly hit a one-month low, but quickly found support near the 100-day moving average, indicating a lack of bearish momentum and a stalemate between bulls and bears.
Currently, the 50-day moving average ($3,344.20/oz) provides short-term support. A break below this level raises the 100-day moving average ($3,278.19/oz) to the next key resistance level. Further declines could test the psychological barrier of $3,275 or even $3,200. The relative strength index (RSI) is currently at 51.41, in neutral territory, indicating a lack of clear market direction. The moving average convergence-divergence (MACD) indicator, while still below zero, is showing a flattening histogram, suggesting that bearish pressure may be waning.
On the upside, if the bulls can regain their footing on the bottom of the ascending triangle pattern and break through the $3,380 resistance level, gold prices are expected to further challenge $3,450 and even retest the all-time high. In the short term, the price may continue to fluctuate in a narrow range around $3,350 unless there is a significant breakout signal from the fundamentals or technicals.
Looking ahead, gold prices will find a balance between Fed policy expectations, global risk sentiment, and geopolitical and trade uncertainties. The continued buildup of expectations for a September Fed rate cut will continue to limit the upside potential of the US dollar and US Treasury yields, providing a floor for gold prices. However, a rebound in global stock markets and a resurgence in risk appetite may curb gold's upward momentum in the short term. Trade-related news (particularly Trump's tariff rhetoric) and further developments in the Russia-Ukraine situation could potentially fuel safe-haven demand for gold, but their actual impact on the global economy and market sentiment remains to be seen.
Technically, gold is likely to continue trading in a narrow range between its 50-day and 100-day moving averages. Key support levels at $3,344.20 and resistance at $3,380 will be the focus of near-term bull-bear trading. A breakout from fundamental data or news could signal a clearer trend for gold prices. Long-term, slowing global economic growth, central bank gold purchases, and persistent geopolitical risks will continue to provide structural support for gold.
In summary, the gold market is currently in a complex environment of mixed bulls and bears. Investors need to pay close attention to US economic data, trade-related news and the performance of key technical points.
Fundamental analysis: macroeconomic environment and policy expectations are intertwined
From a fundamental perspective, gold's recent price action is driven by multiple factors. First, rising expectations for a September Federal Reserve rate cut have become a key factor supporting gold prices. Last Friday's US non-farm payroll data, which fell short of expectations and saw a significant downward revision to the previous reading, fueled market concerns about an economic slowdown and pushed US Treasury yields lower. The 10-year Treasury yield hit a one-month low of 4.19% on Monday before recovering slightly to 4.21% on Tuesday, while the 30-year yield edged up from 4.78% to 4.80%. The US dollar index (DXY), after falling to a one-week low on Monday, stabilized around 99.00 on Tuesday, but remained capped by its recent high of 100.26. Heightened expectations for a rate cut have reduced the upside potential for the US dollar and US Treasury yields, indirectly providing support for gold.
Regarding market sentiment, a rebound in global stock markets weakened gold's safe-haven appeal. The MSCI World Index snapped a six-day losing streak, while the Asia-Pacific Index rose 0.6%. Japan's Nikkei 225 rose 280 points on Tuesday, while Europe's STOXX 50 and STOXX 600 indices both rose approximately 0.4%. The UK's FTSE 100 approached its all-time high of 9,150 points. The three major US stock indices performed particularly strongly on Monday, with the S&P 500 rising 1.5%, the Dow Jones Industrial Average soaring 585 points, and the Nasdaq Composite Index rising 1.9%. The rebound in risk appetite has led investors to pursue higher-yielding assets, temporarily reducing gold's appeal.
Furthermore, trade-related news has become a focal point for the market. Trump's tariff rhetoric has sparked concerns about the uncertainty of the global trade environment. While the specific impact remains unclear, the potential rise in geopolitical and trade risks provides potential support for gold's safe-haven properties. The ongoing tensions between Russia and Ukraine, as well as other geopolitical uncertainties, have also, to a certain extent, reinforced gold's position as a safe-haven asset.
On the data front, today's US economic calendar is relatively quiet. Key releases include the ISM Services PMI, the S&P Global Composite and Services PMI, the Goods and Services Trade Balance, and Redbook Retail Sales. While not blockbuster, these figures may provide further clues to the market regarding consumption, services activity, and external trade. Weak data could further reinforce expectations of a rate cut, positive for gold. Conversely, an unexpectedly strong reading could push up US Treasury yields and the US dollar, putting pressure on gold prices in the short term.
Notably, a recent report from a leading institution indicates that global gold demand reached 2,384 tons in the first half of 2025, the strongest six-month performance since 2013. Investment demand surged, with net inflows of 397 tons into gold ETFs and a 38-ton increase in retail investment demand to 636 tons, offsetting an 18% year-on-year decline in jewelry demand (782 tons). Although central bank gold purchases slowed to 415 tons compared to last year, full-year purchases are expected to remain high at 900-950 tons in 2025, providing long-term support for gold prices. Statements from Federal Reserve officials also offer market clues. San Francisco Fed President Mary Daly stated in a recent interview that the labor market is slowing but has not yet reached "dangerous" levels. She emphasized that the Fed will not postpone policy adjustments indefinitely, but remained cautious about the need for a September rate cut. The market interpreted this as continued expectations for a rate cut, but the pace may be more moderate.
Technical analysis: the game of key support and resistance levels
From a technical perspective, gold prices are consolidating after hitting a two-week high. The daily chart shows the current price at $3,351.31 per ounce, slightly above the 50-day moving average of $3,344.20 per ounce, and still some distance from the 100-day moving average of $3,278.19 per ounce. Last week, gold prices broke below an ascending triangle pattern and briefly hit a one-month low, but quickly found support near the 100-day moving average, indicating a lack of bearish momentum and a stalemate between bulls and bears.
Currently, the 50-day moving average ($3,344.20/oz) provides short-term support. A break below this level raises the 100-day moving average ($3,278.19/oz) to the next key resistance level. Further declines could test the psychological barrier of $3,275 or even $3,200. The relative strength index (RSI) is currently at 51.41, in neutral territory, indicating a lack of clear market direction. The moving average convergence-divergence (MACD) indicator, while still below zero, is showing a flattening histogram, suggesting that bearish pressure may be waning.
On the upside, if the bulls can regain their footing on the bottom of the ascending triangle pattern and break through the $3,380 resistance level, gold prices are expected to further challenge $3,450 and even retest the all-time high. In the short term, the price may continue to fluctuate in a narrow range around $3,350 unless there is a significant breakout signal from the fundamentals or technicals.
Future Trend Outlook
Looking ahead, gold prices will find a balance between Fed policy expectations, global risk sentiment, and geopolitical and trade uncertainties. The continued buildup of expectations for a September Fed rate cut will continue to limit the upside potential of the US dollar and US Treasury yields, providing a floor for gold prices. However, a rebound in global stock markets and a resurgence in risk appetite may curb gold's upward momentum in the short term. Trade-related news (particularly Trump's tariff rhetoric) and further developments in the Russia-Ukraine situation could potentially fuel safe-haven demand for gold, but their actual impact on the global economy and market sentiment remains to be seen.
Technically, gold is likely to continue trading in a narrow range between its 50-day and 100-day moving averages. Key support levels at $3,344.20 and resistance at $3,380 will be the focus of near-term bull-bear trading. A breakout from fundamental data or news could signal a clearer trend for gold prices. Long-term, slowing global economic growth, central bank gold purchases, and persistent geopolitical risks will continue to provide structural support for gold.
In summary, the gold market is currently in a complex environment of mixed bulls and bears. Investors need to pay close attention to US economic data, trade-related news and the performance of key technical points.
- Risk Warning and Disclaimer
- The market involves risk, and trading may not be suitable for all investors. This article is for reference only and does not constitute personal investment advice, nor does it take into account certain users’ specific investment objectives, financial situation, or other needs. Any investment decisions made based on this information are at your own risk.