Alert! Double warning from technical analysis and position changes, beware of the risk of gold prices peaking
2025-08-06 15:25:37
COMEX gold futures continue to consolidate below all-time highs, with technical and sentiment signals suggesting a possible momentum shift. The weekly chart shows a developing symmetrical triangle, suggesting a bullish continuation—though the timing remains uncertain. Meanwhile, despite a short-term rally, large speculators reduced their net long position by nearly 50,000 contracts last week, according to Commodity Futures Trading Commission (COT) data. This divergence suggests that gold may face resistance near $3,500 before any upside breakout materializes.

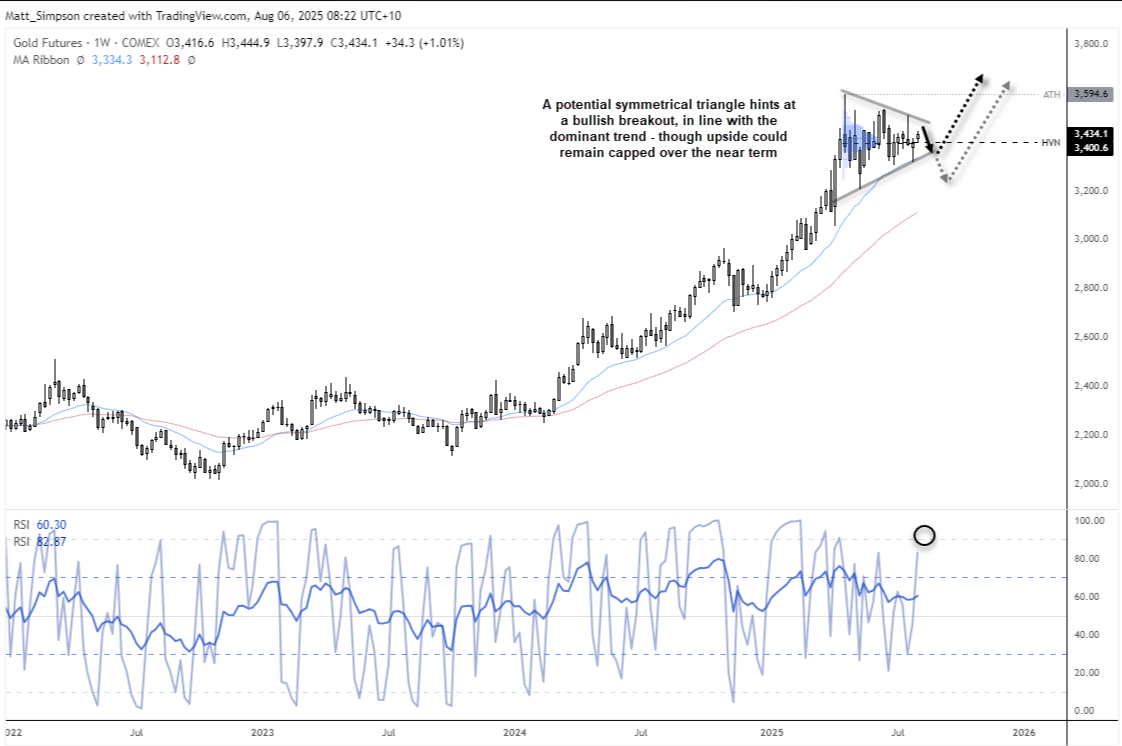
The weekly chart for the most-active COMEX gold futures contract shows that gold futures remain in a solid uptrend, despite significant price volatility since reaching an all-time high in April. Prices have yet to reclaim the shooting star reversal high of 3594.6, having since formed a series of higher lows—each accompanied by bearish patterns such as a dark cloud cover and another shooting star.
This evolving structure suggests a symmetrical triangle is forming, which could resolve with a bullish breakout in line with the primary trend. However, the timing of the breakout is uncertain, and no confirmation has been made yet. The triangle pattern projects an upside target around $3,900 if a successful breakout occurs.
Currently, the price continues to oscillate around the High Volume Node (HVN) near 3400, which generally favors range-bound traders – either selling rallies or buying dips on pullbacks. With the weekly RSI nearing overbought levels, upside for gold bulls in the short term may be limited.
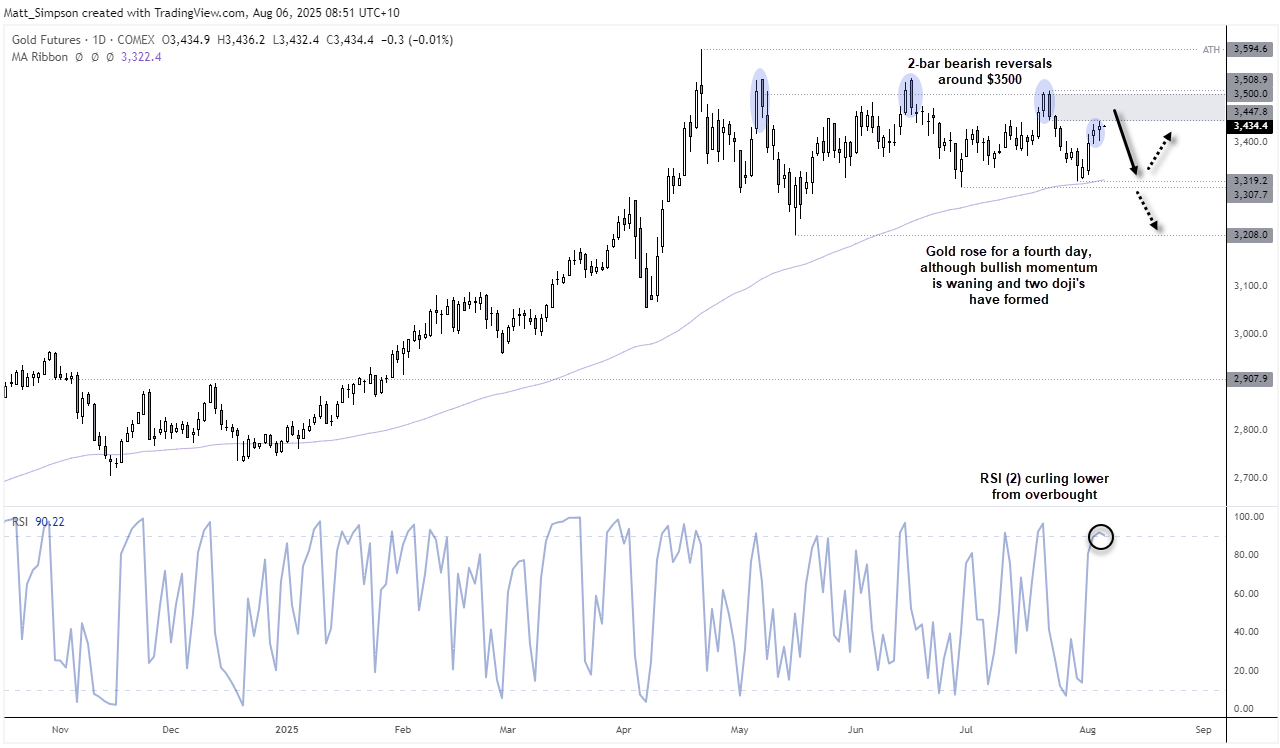
COMEX gold futures saw a slight decline during Wednesday's Asian and European trading hours, currently trading around $3,425 an ounce. COMEX gold futures closed up 0.19% on Tuesday at around $3,435, marking their fourth consecutive day of gains. However, bullish momentum appears to be waning, with two consecutive doji candlestick patterns forming near resistance.
Importantly, the price has been repeatedly blocked in the $3,500 area, forming three clear double candlestick bearish reversal patterns at or just below that level. Now, with the RSI retreating from overbought territory, this pattern suggests that a potential swing high may be forming on the daily chart.
In the event that the price remains below the 3508.9 high, the bears may look to short on rallies in the 3447-3500 range.
The 100-day moving average (3322.4) and the July low (3319.2) are potential downside targets in the short term.
If it falls below the June low (3307.7), it may fall further to the May low (3208.0).
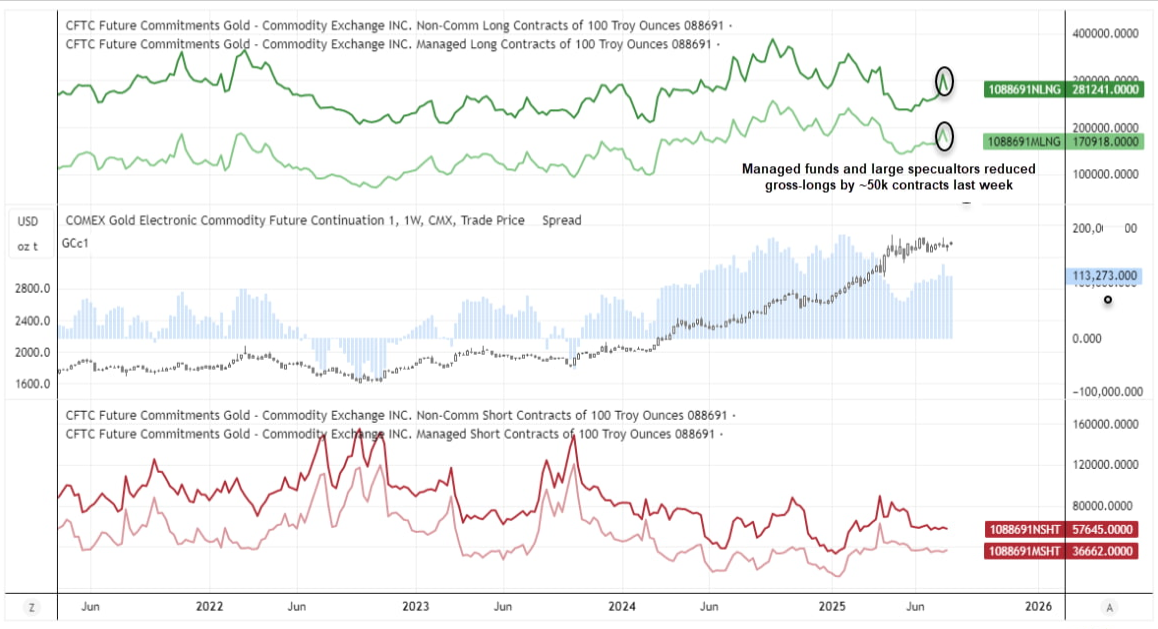
According to the U.S. Commodity Futures Trading Commission (COT), large speculators reduced their net long exposure in gold futures by 29.4k contracts last week, the most aggressive reduction in 16 weeks. While this move was primarily driven by a reduction in gross long positions, which fell by 30.7k contracts (-9.8%), gross short positions decreased slightly by 1.3k contracts (-2.1%).
Asset managers reduced their net-long gold futures exposure by 25,600 contracts last week, bringing the combined net-long exposure of both groups of traders down by about 50,000 contracts. They also reduced their aggregate long position by 23,800 contracts (-12.2%) and increased their short position by 1,800 contracts (5.3%).
While gold prices have since posted four consecutive days of gains, traders remain skeptical that the 50,000 contracts of net long exposure that were reduced last week have been fully recovered. This suggests that gold's gains in the short term may be limited and it may be vulnerable to a pullback on the daily timeframe.
At 15:24 Beijing time, the main contract of COMEX gold futures was quoted at US$3424.1 per ounce.
Weekly chart technical analysis: Upside for gold prices may be limited in the short term
The weekly chart for the most-active COMEX gold futures contract shows that gold futures remain in a solid uptrend, despite significant price volatility since reaching an all-time high in April. Prices have yet to reclaim the shooting star reversal high of 3594.6, having since formed a series of higher lows—each accompanied by bearish patterns such as a dark cloud cover and another shooting star.
This evolving structure suggests a symmetrical triangle is forming, which could resolve with a bullish breakout in line with the primary trend. However, the timing of the breakout is uncertain, and no confirmation has been made yet. The triangle pattern projects an upside target around $3,900 if a successful breakout occurs.
Currently, the price continues to oscillate around the High Volume Node (HVN) near 3400, which generally favors range-bound traders – either selling rallies or buying dips on pullbacks. With the weekly RSI nearing overbought levels, upside for gold bulls in the short term may be limited.
Gold futures technical analysis: daily chart
COMEX gold futures saw a slight decline during Wednesday's Asian and European trading hours, currently trading around $3,425 an ounce. COMEX gold futures closed up 0.19% on Tuesday at around $3,435, marking their fourth consecutive day of gains. However, bullish momentum appears to be waning, with two consecutive doji candlestick patterns forming near resistance.
Importantly, the price has been repeatedly blocked in the $3,500 area, forming three clear double candlestick bearish reversal patterns at or just below that level. Now, with the RSI retreating from overbought territory, this pattern suggests that a potential swing high may be forming on the daily chart.
In the event that the price remains below the 3508.9 high, the bears may look to short on rallies in the 3447-3500 range.
The 100-day moving average (3322.4) and the July low (3319.2) are potential downside targets in the short term.
If it falls below the June low (3307.7), it may fall further to the May low (3208.0).
Position analysis: Gold's gains in the short term may be limited and prone to corrections
According to the U.S. Commodity Futures Trading Commission (COT), large speculators reduced their net long exposure in gold futures by 29.4k contracts last week, the most aggressive reduction in 16 weeks. While this move was primarily driven by a reduction in gross long positions, which fell by 30.7k contracts (-9.8%), gross short positions decreased slightly by 1.3k contracts (-2.1%).
Asset managers reduced their net-long gold futures exposure by 25,600 contracts last week, bringing the combined net-long exposure of both groups of traders down by about 50,000 contracts. They also reduced their aggregate long position by 23,800 contracts (-12.2%) and increased their short position by 1,800 contracts (5.3%).
While gold prices have since posted four consecutive days of gains, traders remain skeptical that the 50,000 contracts of net long exposure that were reduced last week have been fully recovered. This suggests that gold's gains in the short term may be limited and it may be vulnerable to a pullback on the daily timeframe.
At 15:24 Beijing time, the main contract of COMEX gold futures was quoted at US$3424.1 per ounce.
- Risk Warning and Disclaimer
- The market involves risk, and trading may not be suitable for all investors. This article is for reference only and does not constitute personal investment advice, nor does it take into account certain users’ specific investment objectives, financial situation, or other needs. Any investment decisions made based on this information are at your own risk.