Did spot gold fall at the opening? This week's US CPI data may determine the outcome.
2025-08-11 11:11:13
Spot gold fell 0.57% during the Asian session on Monday (August 11), holding near last Monday's opening price, currently trading at $3,376.89 per ounce. Confusion surrounding gold tariffs on Friday (August 8) sent gold futures prices soaring to a record high, while spot gold prices remained largely unchanged, closing just below the key $3,400 level. Despite this, the precious metal still enjoyed a solid week, rising 1% and securing its second consecutive weekly gain. Despite a sharp increase in risk appetite due to sharp gains in global indices, gold continued to perform well, driven by a weaker US dollar and data. In the new week, the US Consumer Price Index (CPI) is likely to set the tone for the US dollar and bond yields, in turn impacting the outlook for gold.

Confusion about gold tariffs
The Trump administration announced last Friday (August 8) that it would issue a new policy clarifying that imported gold bars would be exempt from tariffs. Earlier, reports that one-kilogram and 100-ounce gold bars would face equivalent tariffs sent gold futures prices soaring to new record highs. Both spot and futures prices subsequently retreated from earlier highs.
Stocks surged as safe-haven demand eased after Trump said he planned to meet with Russian President Vladimir Putin "very soon." Trump hopes to broker a ceasefire in the Russia-Ukraine conflict. This optimism weighed on oil prices, which fell for the seventh consecutive day, while surprisingly, gold prices remained higher at the end of their rally.
Focus on US inflation data this week: CPI, PPI and University of Michigan inflation expectations
Gold's outlook will be tested again in the coming week with the release of US inflation and retail sales data. Consumer Price Index (CPI) data will be released on Tuesday, August 12, followed by Producer Price Index (PPI) data on Thursday. On Friday, the focus will shift to the release of the University of Michigan Inflation Expectations Survey, along with data on the University of Michigan Consumer Sentiment Index, retail sales, the Empire State Manufacturing Index, and industrial production.
While the Federal Reserve's dual mandate includes promoting maximum employment, its other primary goal is price stability—specifically, keeping inflation around its 2% long-term target. As concerns about future inflation grow—partly due to the potential inflationary impact of Trump's tariffs—investors are eager to see whether businesses are beginning to pass on higher input costs to consumers. So far, this hasn't been the case, with CPI figures for the past five months falling short of expectations. But could this trend now reverse?
The upcoming PPI report will also bear close attention as it directly feeds into the Fed’s preferred inflation measure, the core personal consumption expenditures (PCE) index, which will be released later this month.
Meanwhile, Friday's University of Michigan inflation forecasts may attract some attention, but the retail sales data will likely receive more attention. Any combination of weak consumer spending data and rising inflation could spark concerns about stagflation.
Fed expected to cut interest rates in September
A recent series of weaker-than-expected employment data has reignited market expectations that the Federal Reserve may begin cutting interest rates as early as September, with another cut possible in October. A December meeting is now seen as a 50-50 chance. Further downward pressure on the dollar came from weak ISM services and manufacturing PMI data, as well as rising initial jobless claims. Reflecting this shift, several Fed officials recently acknowledged the possibility of multiple rate cuts this year, even though inflation risks remain. This has supported gold prices despite a sharp rise in the stock market.
Gold outlook: key price levels to watch
Spot gold prices closed Friday near a bearish trendline formed since the April peak. They fell 0.57% during Monday's Asian session, posing the possibility of an evening star formation. A close below $3,300 would likely turn the outlook bearish in the coming days. Conversely, a breakout above the trendline and resistance at $3,400 could pave the way for new all-time highs. Initial support is currently seen around $3,365, followed by $3,350 and $3,335, with $3,300 being the most critical level in the short term.
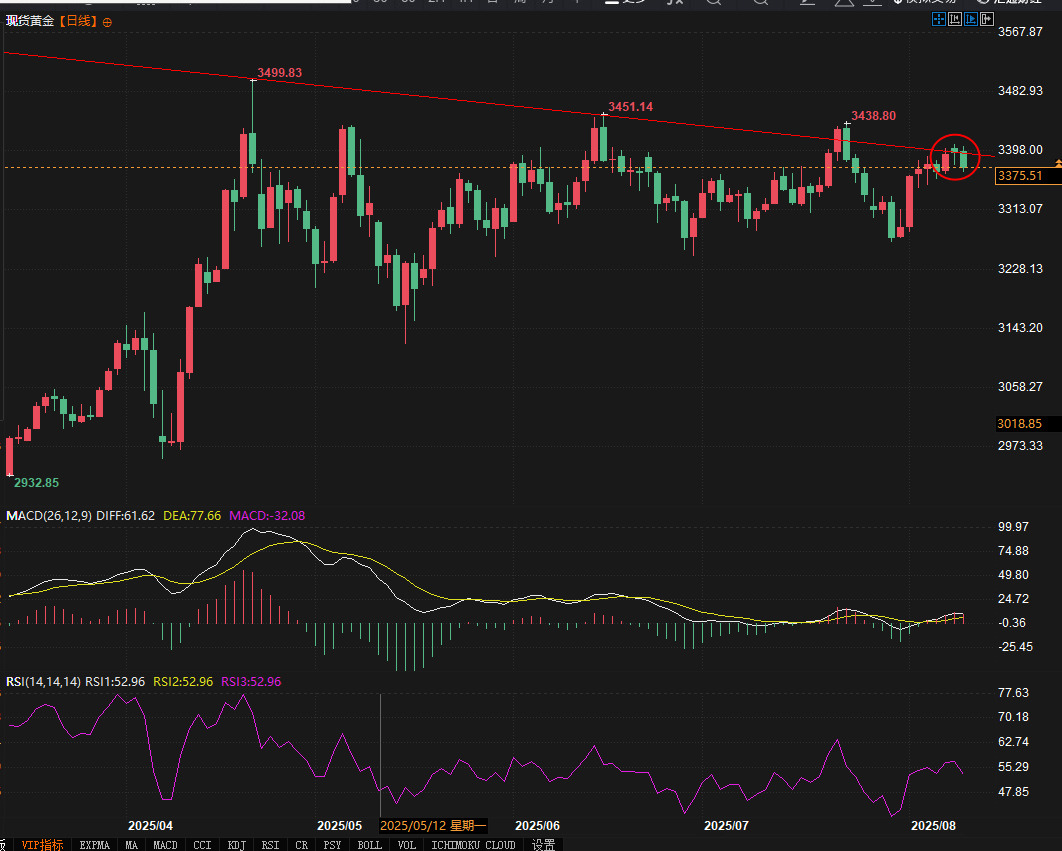
(Spot gold daily chart, source: Yihuitong)
At 11:08 Beijing time, spot gold was trading at $3,377.95 per ounce.
Confusion about gold tariffs
The Trump administration announced last Friday (August 8) that it would issue a new policy clarifying that imported gold bars would be exempt from tariffs. Earlier, reports that one-kilogram and 100-ounce gold bars would face equivalent tariffs sent gold futures prices soaring to new record highs. Both spot and futures prices subsequently retreated from earlier highs.
Stocks surged as safe-haven demand eased after Trump said he planned to meet with Russian President Vladimir Putin "very soon." Trump hopes to broker a ceasefire in the Russia-Ukraine conflict. This optimism weighed on oil prices, which fell for the seventh consecutive day, while surprisingly, gold prices remained higher at the end of their rally.
Focus on US inflation data this week: CPI, PPI and University of Michigan inflation expectations
Gold's outlook will be tested again in the coming week with the release of US inflation and retail sales data. Consumer Price Index (CPI) data will be released on Tuesday, August 12, followed by Producer Price Index (PPI) data on Thursday. On Friday, the focus will shift to the release of the University of Michigan Inflation Expectations Survey, along with data on the University of Michigan Consumer Sentiment Index, retail sales, the Empire State Manufacturing Index, and industrial production.
While the Federal Reserve's dual mandate includes promoting maximum employment, its other primary goal is price stability—specifically, keeping inflation around its 2% long-term target. As concerns about future inflation grow—partly due to the potential inflationary impact of Trump's tariffs—investors are eager to see whether businesses are beginning to pass on higher input costs to consumers. So far, this hasn't been the case, with CPI figures for the past five months falling short of expectations. But could this trend now reverse?
The upcoming PPI report will also bear close attention as it directly feeds into the Fed’s preferred inflation measure, the core personal consumption expenditures (PCE) index, which will be released later this month.
Meanwhile, Friday's University of Michigan inflation forecasts may attract some attention, but the retail sales data will likely receive more attention. Any combination of weak consumer spending data and rising inflation could spark concerns about stagflation.
Fed expected to cut interest rates in September
A recent series of weaker-than-expected employment data has reignited market expectations that the Federal Reserve may begin cutting interest rates as early as September, with another cut possible in October. A December meeting is now seen as a 50-50 chance. Further downward pressure on the dollar came from weak ISM services and manufacturing PMI data, as well as rising initial jobless claims. Reflecting this shift, several Fed officials recently acknowledged the possibility of multiple rate cuts this year, even though inflation risks remain. This has supported gold prices despite a sharp rise in the stock market.
Gold outlook: key price levels to watch
Spot gold prices closed Friday near a bearish trendline formed since the April peak. They fell 0.57% during Monday's Asian session, posing the possibility of an evening star formation. A close below $3,300 would likely turn the outlook bearish in the coming days. Conversely, a breakout above the trendline and resistance at $3,400 could pave the way for new all-time highs. Initial support is currently seen around $3,365, followed by $3,350 and $3,335, with $3,300 being the most critical level in the short term.
(Spot gold daily chart, source: Yihuitong)
At 11:08 Beijing time, spot gold was trading at $3,377.95 per ounce.
- Risk Warning and Disclaimer
- The market involves risk, and trading may not be suitable for all investors. This article is for reference only and does not constitute personal investment advice, nor does it take into account certain users’ specific investment objectives, financial situation, or other needs. Any investment decisions made based on this information are at your own risk.