The trend "judgment day" is approaching, the battle for the US dollar index 97.70 has ended, and the short position has taken control of the market.
2025-08-13 19:58:42
On Wednesday (August 13), the US Dollar Index (DXY) continued its recent weakness. Market sentiment was influenced by the latest US inflation data and Federal Reserve policy expectations, coupled with external uncertainties. After fluctuating at a high level, the US Dollar Index showed further downward pressure. During the day, the US Dollar Index failed to break through key resistance levels, indicating that heightened market expectations for Fed rate cuts and concerns about the independence of US institutions are driving market trends. Furthermore, uncertainty in the global economic environment and the dynamics of non-US currencies have complicated the fluctuations of the US Dollar Index. This article will analyze the current trend and potential future direction of the US Dollar Index from both fundamental and technical perspectives, incorporating the latest market dynamics.

Inflation Data Draws Market Attention <br/>The US Consumer Price Index (CPI) data for July was released this week. Headline inflation rose 2.7% year-on-year, slightly below market expectations of 2.8%, while core CPI rose 3.1% year-on-year, slightly above the expected 3.0%. This combination of data signals a mixed bag: the decline in headline inflation provides more room for the Federal Reserve to cut interest rates in September, while the stickiness of core inflation may limit the extent of the cut. The market's greater focus on headline inflation data put downward pressure on the US dollar. Leading institutions noted that investors tended to focus on the weaker-than-expected headline CPI performance rather than the unexpectedly higher core CPI data, which directly contributed to the decline in the US dollar index following the data release.
Fed Policy Expectations Dominate Market Sentiment <br/>The Federal Reserve's September meeting has become a focal point for the market, further fueling expectations of a rate cut. Recent comments from US Treasury officials suggest the Fed may consider a 50 basis point rate cut in September, fueling market expectations of looser monetary policy. Despite inflation remaining around 3%, dovish stances from some Fed officials have further fueled bets on a rate cut. For example, dovish comments from one Fed voting member suggest that inflation has been "well behaved," potentially paving the way for looser policy. However, the market also notes that disagreements persist within the Fed over the pace of rate cuts, with hawkish voices from non-voting members potentially constraining policy decisions.
External uncertainties exacerbate pressure on the US dollar . The US dollar index's performance is also influenced by the US domestic policy environment. Recent comments from Trump regarding tariffs and his public criticism of Federal Reserve Chairman Powell have sparked market concerns about the Fed's independence. A prominent analyst noted that Trump's continued pressure on Powell, coupled with his nominee for the interim Fed governor's optimistic outlook on inflation, could further weaken the dollar's safe-haven appeal. Furthermore, Trump's nominee for the head of the Bureau of Labor Statistics has suggested suspending the release of monthly employment data in favor of "more accurate but less timely" data updates. This proposal has raised market doubts about the credibility of US economic data, indirectly pressuring the dollar. Some users have also expressed concerns about the Fed's declining policy independence and data transparency, believing these factors could lead the market to price a higher risk premium in the dollar.
Global Economic and Non-US Currency Dynamics <br/>The global economic environment has added further uncertainty to the US dollar's trajectory. The International Monetary Fund (IMF) recently raised its global economic growth forecast for 2025, projecting growth of 4.1% for emerging market and developing economies and 4.8% for China in 2025. This optimistic outlook has boosted the appeal of non-US currencies, particularly the euro and the renminbi. The euro rose 0.52% against the dollar on Wednesday to 1.1675, while the pound rose 0.51% against the dollar to 1.35. In contrast, the yen and the Australian dollar performed relatively modestly, with USD/JPY falling 0.21% to 147.84 and AUD/USD rising 0.26% to 0.653. The dynamics of these non-US currencies reflect waning confidence in the dollar's short-term strength and are also influenced by diverging global monetary policies. For example, the European Central Bank is likely to continue its aggressive interest rate cuts, while uncertainty over the timing of Bank of Japan rate hikes is weighing on the yen.
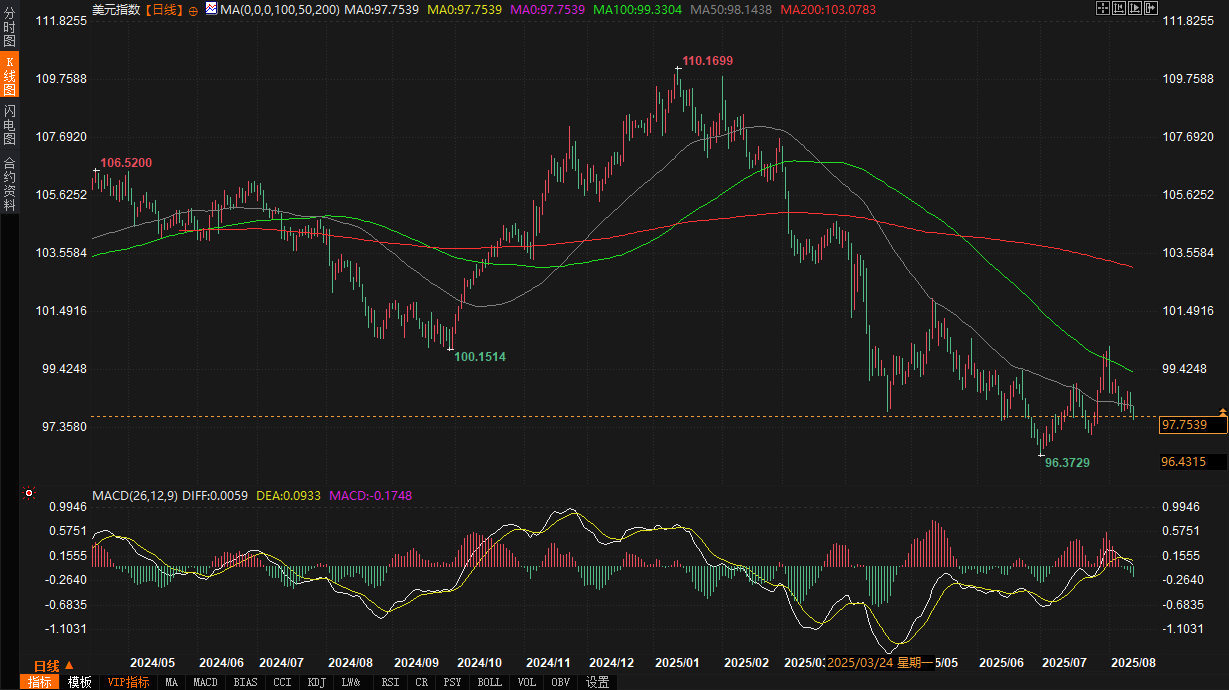
US Dollar Index Short-Term Trend and Key Levels <br/>From a technical perspective, the US Dollar Index is currently trading at a critical support level. The latest price of 97.7630 has already pierced the bottom of the July and August consolidation range at 97.70. Reputable institutional analysts suggest that a break below 97.70 could signal further declines, potentially targeting the year-to-date low of 96.373. A break below this level could trigger a test of the psychological barrier near 95.00. During the day, the US Dollar Index reached a high of 98.1040 and a low of 97.9970, indicating increased short-term volatility but overall bearish momentum. In late July and early August, the US Dollar Index attempted to break through the Fibonacci resistance level of 99.932 but failed to hold, leading to a rapid decline, highlighting a lack of bullish momentum.
Moving Average System and Trend Signals <br/>On the daily chart, the US Dollar Index is currently trading below its 50-day moving average (98.1440) and is significantly below its 100-day moving average (99.3306) and 200-day moving averages (103.0783), indicating a bearish medium-term trend. The loss of the 50-day moving average further reinforces the bearish signal. If the index fails to reclaim this level quickly in the short term, further declines are possible. The significant gap between the long-term moving average (200-day moving average at 103.0783) and the current level suggests that the correction since the early 200-day moving average reached its high of 110 has yet to reach long-term support, suggesting further downward movement.
MACD indicator analysis
The MACD indicator (26, 12, 9) shows a DIFF value of 0.0060, a DEA value of 0.0932, and a MACD value of -0.1748, indicating that current market momentum favors the bears. The positive DIFF and DEA values suggest a potential rebound in the short term, but the persistently negative MACD means suggests that the overall trend remains dominated by bears. If the MACD line crosses below zero, bearish momentum could intensify, potentially accelerating the decline of the US dollar index.
Resistance and Support Analysis <br/>Short-term resistance lies in the 98.70/80 area, which has repeatedly acted as a resistance line for recent rebounds. Yesterday's selling pressure further confirmed the effectiveness of this resistance range. Regarding support below, the loss of 97.70 makes 96.37 (the July 24 low) the next key target. A break below 96.37 would likely bring the market's attention to the psychological level around 95.00. Overall, the US dollar index is likely to continue its volatile downward trend in the short term, unless significant positive fundamentals emerge to reverse the current bearish trend.
Looking ahead, the US dollar index will continue to face pressure from both fundamental and technical factors. From a fundamental perspective, rising expectations for a September Fed rate cut will be the primary pressure on the US dollar index. If US economic data continues to show signs of slowing inflation or weak employment figures, market bets on rate cuts could intensify, pushing the US dollar index further towards support levels of 96.37 or even 95.00. Meanwhile, Trump's tariff rhetoric and potential interference with the Fed's independence are likely to continue to create uncertainty for the US dollar. Rising market risk premiums will weaken the dollar's safe-haven appeal. Strengthening expectations for a global economic recovery, particularly the resilience of emerging market currencies, could further divert US dollar inflows.
Technically, after breaking support at 97.70, the US Dollar Index is likely to continue its downward trend in the short term, targeting 96.37. The suppressive effect of the 50-day moving average and the bearish MACD indicator suggest limited potential for a short-term rebound. Barring a major fundamental catalyst, the US Dollar Index will struggle to reclaim the 98.70/80 resistance zone. In the medium to long term, the 200-day moving average (103.0783) remains a key trend dividing line. If the US Dollar Index continues to move away from this moving average, the correction period could be further prolonged.
Overall, the US dollar index is likely to continue fluctuating between 96.37 and 98.70 in the short term. The market will closely monitor the latest statements from Federal Reserve officials, US economic data, and dynamic changes in global monetary policy. Investors should remain cautious and closely monitor the latest fundamental and technical signals to understand the potential fluctuations of the US dollar index.
Fundamental analysis: Rising expectations of interest rate cuts and policy uncertainty
Inflation Data Draws Market Attention <br/>The US Consumer Price Index (CPI) data for July was released this week. Headline inflation rose 2.7% year-on-year, slightly below market expectations of 2.8%, while core CPI rose 3.1% year-on-year, slightly above the expected 3.0%. This combination of data signals a mixed bag: the decline in headline inflation provides more room for the Federal Reserve to cut interest rates in September, while the stickiness of core inflation may limit the extent of the cut. The market's greater focus on headline inflation data put downward pressure on the US dollar. Leading institutions noted that investors tended to focus on the weaker-than-expected headline CPI performance rather than the unexpectedly higher core CPI data, which directly contributed to the decline in the US dollar index following the data release.
Fed Policy Expectations Dominate Market Sentiment <br/>The Federal Reserve's September meeting has become a focal point for the market, further fueling expectations of a rate cut. Recent comments from US Treasury officials suggest the Fed may consider a 50 basis point rate cut in September, fueling market expectations of looser monetary policy. Despite inflation remaining around 3%, dovish stances from some Fed officials have further fueled bets on a rate cut. For example, dovish comments from one Fed voting member suggest that inflation has been "well behaved," potentially paving the way for looser policy. However, the market also notes that disagreements persist within the Fed over the pace of rate cuts, with hawkish voices from non-voting members potentially constraining policy decisions.
External uncertainties exacerbate pressure on the US dollar . The US dollar index's performance is also influenced by the US domestic policy environment. Recent comments from Trump regarding tariffs and his public criticism of Federal Reserve Chairman Powell have sparked market concerns about the Fed's independence. A prominent analyst noted that Trump's continued pressure on Powell, coupled with his nominee for the interim Fed governor's optimistic outlook on inflation, could further weaken the dollar's safe-haven appeal. Furthermore, Trump's nominee for the head of the Bureau of Labor Statistics has suggested suspending the release of monthly employment data in favor of "more accurate but less timely" data updates. This proposal has raised market doubts about the credibility of US economic data, indirectly pressuring the dollar. Some users have also expressed concerns about the Fed's declining policy independence and data transparency, believing these factors could lead the market to price a higher risk premium in the dollar.
Global Economic and Non-US Currency Dynamics <br/>The global economic environment has added further uncertainty to the US dollar's trajectory. The International Monetary Fund (IMF) recently raised its global economic growth forecast for 2025, projecting growth of 4.1% for emerging market and developing economies and 4.8% for China in 2025. This optimistic outlook has boosted the appeal of non-US currencies, particularly the euro and the renminbi. The euro rose 0.52% against the dollar on Wednesday to 1.1675, while the pound rose 0.51% against the dollar to 1.35. In contrast, the yen and the Australian dollar performed relatively modestly, with USD/JPY falling 0.21% to 147.84 and AUD/USD rising 0.26% to 0.653. The dynamics of these non-US currencies reflect waning confidence in the dollar's short-term strength and are also influenced by diverging global monetary policies. For example, the European Central Bank is likely to continue its aggressive interest rate cuts, while uncertainty over the timing of Bank of Japan rate hikes is weighing on the yen.
Technical analysis: Key support faces test
US Dollar Index Short-Term Trend and Key Levels <br/>From a technical perspective, the US Dollar Index is currently trading at a critical support level. The latest price of 97.7630 has already pierced the bottom of the July and August consolidation range at 97.70. Reputable institutional analysts suggest that a break below 97.70 could signal further declines, potentially targeting the year-to-date low of 96.373. A break below this level could trigger a test of the psychological barrier near 95.00. During the day, the US Dollar Index reached a high of 98.1040 and a low of 97.9970, indicating increased short-term volatility but overall bearish momentum. In late July and early August, the US Dollar Index attempted to break through the Fibonacci resistance level of 99.932 but failed to hold, leading to a rapid decline, highlighting a lack of bullish momentum.
Moving Average System and Trend Signals <br/>On the daily chart, the US Dollar Index is currently trading below its 50-day moving average (98.1440) and is significantly below its 100-day moving average (99.3306) and 200-day moving averages (103.0783), indicating a bearish medium-term trend. The loss of the 50-day moving average further reinforces the bearish signal. If the index fails to reclaim this level quickly in the short term, further declines are possible. The significant gap between the long-term moving average (200-day moving average at 103.0783) and the current level suggests that the correction since the early 200-day moving average reached its high of 110 has yet to reach long-term support, suggesting further downward movement.
MACD indicator analysis
The MACD indicator (26, 12, 9) shows a DIFF value of 0.0060, a DEA value of 0.0932, and a MACD value of -0.1748, indicating that current market momentum favors the bears. The positive DIFF and DEA values suggest a potential rebound in the short term, but the persistently negative MACD means suggests that the overall trend remains dominated by bears. If the MACD line crosses below zero, bearish momentum could intensify, potentially accelerating the decline of the US dollar index.
Resistance and Support Analysis <br/>Short-term resistance lies in the 98.70/80 area, which has repeatedly acted as a resistance line for recent rebounds. Yesterday's selling pressure further confirmed the effectiveness of this resistance range. Regarding support below, the loss of 97.70 makes 96.37 (the July 24 low) the next key target. A break below 96.37 would likely bring the market's attention to the psychological level around 95.00. Overall, the US dollar index is likely to continue its volatile downward trend in the short term, unless significant positive fundamentals emerge to reverse the current bearish trend.
Future Trend Outlook
Looking ahead, the US dollar index will continue to face pressure from both fundamental and technical factors. From a fundamental perspective, rising expectations for a September Fed rate cut will be the primary pressure on the US dollar index. If US economic data continues to show signs of slowing inflation or weak employment figures, market bets on rate cuts could intensify, pushing the US dollar index further towards support levels of 96.37 or even 95.00. Meanwhile, Trump's tariff rhetoric and potential interference with the Fed's independence are likely to continue to create uncertainty for the US dollar. Rising market risk premiums will weaken the dollar's safe-haven appeal. Strengthening expectations for a global economic recovery, particularly the resilience of emerging market currencies, could further divert US dollar inflows.
Technically, after breaking support at 97.70, the US Dollar Index is likely to continue its downward trend in the short term, targeting 96.37. The suppressive effect of the 50-day moving average and the bearish MACD indicator suggest limited potential for a short-term rebound. Barring a major fundamental catalyst, the US Dollar Index will struggle to reclaim the 98.70/80 resistance zone. In the medium to long term, the 200-day moving average (103.0783) remains a key trend dividing line. If the US Dollar Index continues to move away from this moving average, the correction period could be further prolonged.
Overall, the US dollar index is likely to continue fluctuating between 96.37 and 98.70 in the short term. The market will closely monitor the latest statements from Federal Reserve officials, US economic data, and dynamic changes in global monetary policy. Investors should remain cautious and closely monitor the latest fundamental and technical signals to understand the potential fluctuations of the US dollar index.
- Risk Warning and Disclaimer
- The market involves risk, and trading may not be suitable for all investors. This article is for reference only and does not constitute personal investment advice, nor does it take into account certain users’ specific investment objectives, financial situation, or other needs. Any investment decisions made based on this information are at your own risk.