USD Outlook: PPI data exceeded expectations, raising questions about the Fed's interest rate cut, and the US dollar index rebounded
2025-08-15 01:32:58
On Thursday (August 14), the July data from the U.S. Producer Price Index (PPI) exceeded expectations, challenging recent dovish market expectations for a Federal Reserve rate cut. The U.S. dollar index subsequently recovered losses, ending a two-day losing streak. The data showed that U.S. wholesale prices rose 0.9% month-over-month, driven by rising costs for services and goods, far exceeding the consensus forecast of a 0.2% increase.
Expectations for a Fed rate cut remain, but the extent of the September cut remains in doubt
Despite the sharp rise in inflation data, the federal funds futures market still expects a 93% probability of a 25 basis point rate cut at the Fed's September 17 meeting, according to the Chicago Mercantile Exchange's (CME) Fed Watch Tool. However, after the release of the PPI data, market speculation about a larger rate cut (50 basis points) by the Fed has been largely eliminated.
Treasury Secretary Scott Bessent had previously hinted at a possible 50 basis point rate cut, but that possibility has now become remote. Matt Weller of StoneX Group noted that the data suggests "it's hard to justify more than one or two rate cuts this year," a view that underscores market concerns that the Federal Reserve has limited room to pursue an aggressive easing cycle without further deterioration in the labor market.
U.S. Treasury yields edge higher as sticky inflation risks rise
In response to the PPI data, short-term U.S. Treasury yields rose: the 2-year Treasury yield rose 4.3 basis points to 3.73%, and the benchmark 10-year Treasury yield rose 4.1 basis points to 4.281%. Although consumer inflation data released earlier this week showed a slight easing, the accelerated rise in the PPI data suggests that underlying inflationary pressures may still be accumulating, which may further complicate the Federal Reserve's future policy path.
Jackson Hole Annual Meeting becomes key to clarify interest rate policy
Traders are currently focused on the Federal Reserve's annual Jackson Hole symposium, scheduled for August 21-23. Fed Chairman Powell's speech at the symposium could recalibrate market expectations. Deutsche Bank analysts remind the market that Powell has repeatedly used this platform to signal key policy shifts. If Powell signals a cautious approach to inflation, it could dampen market expectations of multiple Fed rate cuts.
The US dollar index fluctuates around the 50-day moving average
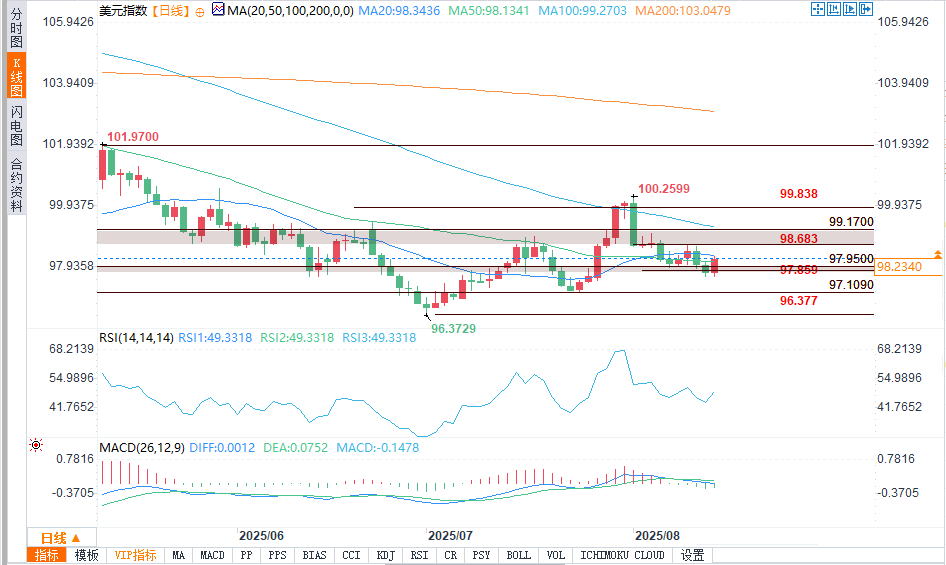
(Source of US Dollar Index daily chart: Yihuitong)
Looking at the daily chart of the US Dollar Index (DXY), the index is currently fluctuating slightly above its 50-day moving average (98.1), a level that has become a key pivot point for short-term price action. Earlier this week, the DXY dipped below this moving average but regained its footing following the release of the PPI data. Traders are closely watching for a clear close above this moving average; such a breakout could pave the way for a broader bullish move in the index.
Market Outlook: All eyes on Powell at the Jackson Hole symposium
The US dollar index is currently fluctuating around its 50-day moving average, with traders awaiting clarity from the Federal Reserve's Jackson Hole annual meeting (August 21-23). If Powell strikes a dovish tone in his speech, the dollar index could fall back below the key moving average of 98.1 and test lower levels.
However, if Powell sends a hawkish signal, it may consolidate the support of the 50-day moving average and push the US dollar index further up. Until then, the price trend of the US dollar index will continue to be dominated by this moving average, and its performance will continue to influence short-term market sentiment.
At 01:29 Beijing time, the US dollar index was at 98.2480/640, up 0.48%.
Expectations for a Fed rate cut remain, but the extent of the September cut remains in doubt
Despite the sharp rise in inflation data, the federal funds futures market still expects a 93% probability of a 25 basis point rate cut at the Fed's September 17 meeting, according to the Chicago Mercantile Exchange's (CME) Fed Watch Tool. However, after the release of the PPI data, market speculation about a larger rate cut (50 basis points) by the Fed has been largely eliminated.
Treasury Secretary Scott Bessent had previously hinted at a possible 50 basis point rate cut, but that possibility has now become remote. Matt Weller of StoneX Group noted that the data suggests "it's hard to justify more than one or two rate cuts this year," a view that underscores market concerns that the Federal Reserve has limited room to pursue an aggressive easing cycle without further deterioration in the labor market.
U.S. Treasury yields edge higher as sticky inflation risks rise
In response to the PPI data, short-term U.S. Treasury yields rose: the 2-year Treasury yield rose 4.3 basis points to 3.73%, and the benchmark 10-year Treasury yield rose 4.1 basis points to 4.281%. Although consumer inflation data released earlier this week showed a slight easing, the accelerated rise in the PPI data suggests that underlying inflationary pressures may still be accumulating, which may further complicate the Federal Reserve's future policy path.
Jackson Hole Annual Meeting becomes key to clarify interest rate policy
Traders are currently focused on the Federal Reserve's annual Jackson Hole symposium, scheduled for August 21-23. Fed Chairman Powell's speech at the symposium could recalibrate market expectations. Deutsche Bank analysts remind the market that Powell has repeatedly used this platform to signal key policy shifts. If Powell signals a cautious approach to inflation, it could dampen market expectations of multiple Fed rate cuts.
The US dollar index fluctuates around the 50-day moving average
(Source of US Dollar Index daily chart: Yihuitong)
Looking at the daily chart of the US Dollar Index (DXY), the index is currently fluctuating slightly above its 50-day moving average (98.1), a level that has become a key pivot point for short-term price action. Earlier this week, the DXY dipped below this moving average but regained its footing following the release of the PPI data. Traders are closely watching for a clear close above this moving average; such a breakout could pave the way for a broader bullish move in the index.
Market Outlook: All eyes on Powell at the Jackson Hole symposium
The US dollar index is currently fluctuating around its 50-day moving average, with traders awaiting clarity from the Federal Reserve's Jackson Hole annual meeting (August 21-23). If Powell strikes a dovish tone in his speech, the dollar index could fall back below the key moving average of 98.1 and test lower levels.
However, if Powell sends a hawkish signal, it may consolidate the support of the 50-day moving average and push the US dollar index further up. Until then, the price trend of the US dollar index will continue to be dominated by this moving average, and its performance will continue to influence short-term market sentiment.
At 01:29 Beijing time, the US dollar index was at 98.2480/640, up 0.48%.
- Risk Warning and Disclaimer
- The market involves risk, and trading may not be suitable for all investors. This article is for reference only and does not constitute personal investment advice, nor does it take into account certain users’ specific investment objectives, financial situation, or other needs. Any investment decisions made based on this information are at your own risk.