No truce on a closed day: Gold consolidates at high levels, is the best strategy before NFP to wait for a backtest?
2025-09-01 17:56:46
Spot gold (XAU/USD) maintained its highs during the first half of the European trading session on Monday (September 1st). The hourly chart shows it fluctuating around $3,470, not far from its intraday high of 3,489.78. It also remained above the middle Bollinger Band at 3,447.23 and approached the upper Bollinger Band at 3,497.92. Macroeconomic expectations of a Federal Reserve rate cut this month weighed on the US dollar. Renewed geopolitical uncertainty boosted gold prices with safe-haven demand. However, short-term indicators entered a relatively bullish range, temporarily slowing the upward trend.

Inflation and Policy Expectations: The US PCE price index remained at an annualized rate of 2.6% in July, while the core PCE rose slightly from 2.8% to 2.9%, in line with market expectations. Despite persistent inflationary pressures, the market continues to bet on the Federal Reserve cutting interest rates this month. CME FedWatch data shows an 87% probability of a 25 basis point rate cut this month, with at least one more cut expected this year. This combination mitigates the cost disadvantage of holding non-interest-bearing assets, providing medium-term support for gold.
Controversy over Federal Reserve independence: News reports indicate that US President Trump dismissed Governor Lisa Cook, who filed a lawsuit and refused to resign, raising concerns about the Fed's independence. If the Board of Governors were to undergo a restructuring, altering the voting majority structure, the market's confidence level on the policy path could widen. Increased US dollar volatility and rising safe-haven demand would indirectly benefit gold.
Geopolitical risks: The Russia-Ukraine conflict and the situation in the Middle East remain tense, strengthening the "risk-averse-hedge" logic and enhancing the risk hedging properties of gold.
Trading schedule and liquidity: The U.S. market is closed today for Labor Day, so trading volume may decline temporarily, and the risk of spreads and slippage will increase. The key data later this week is Friday's non-farm payrolls (NFP). Before that, funds are more inclined to fine-tune their positions based on policy expectations and geopolitical pulses.
The hourly chart shows a typical "strong trend + high-level consolidation" combination. Bollinger Bands indicate: middle band 3447.23, upper band 3497.92, and lower band 3396.54. The widening band indicates that trend momentum is still being released, but approaching the upper band is likely to trigger a mean reversion action of "intra-band retracement-mid-band retracement".
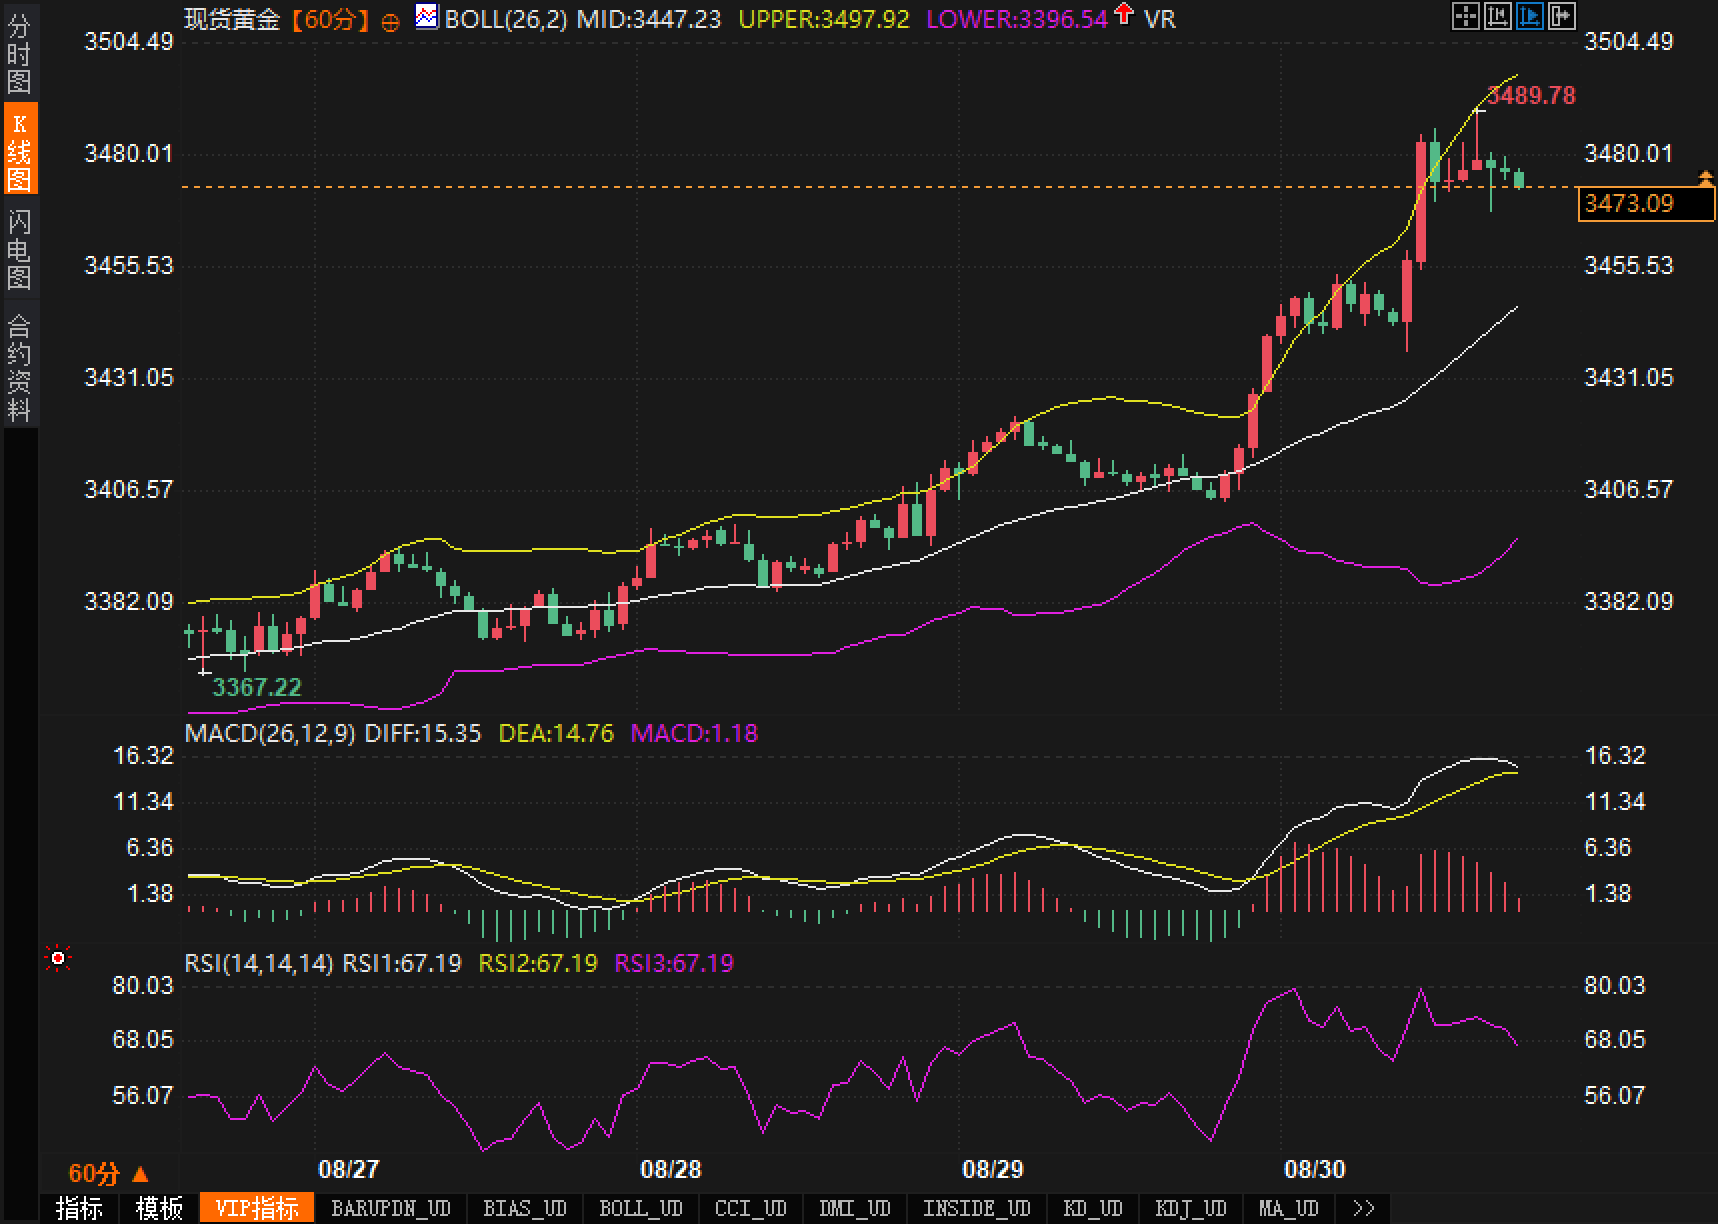
Regarding momentum indicators, the MACD shows a DIFF of 15.35, a DEA of 14.76, and a histogram of 1.18, all positive, but the bars are slightly narrower than before, signaling a "slowdown in high-level bullishness"—more of a rhythm adjustment than a trend reversal. The RSI (14) is at 67.19, below the overbought threshold of 70, reflecting strong but not extreme momentum.
Based on this, key short-term resistance lies at 3489.78 (current high) and 3497.92 (upper Bollinger band), with resistance above the 3500 round number. Support is expected at 3447.23 (middle Bollinger band/dynamic support), followed by static support near 3430 and 3400, as well as 3396.54 (lower Bollinger band) and 3367.22 (previous low/trend boundary). As long as the middle Bollinger band remains intact, the hourly rising channel remains valid, and the retest favors a healthy consolidation.
The current narrative is clear: rate cut expectations, a weak US dollar, and geopolitical uncertainty = a structurally bullish sentiment for gold. Meanwhile, hourly indicators are in a relatively bullish range, leading traders to be reluctant to chase prices near the upper band, preferring to wait for a pullback within the band and a cooling of indicators before re-entering the market. This has led to short-term tug-of-war and sideways trading. Overall, market sentiment is stable yet optimistic, with a strong consensus on buying safe-haven assets on dips, but also wary of data setbacks.
Short-term (1-3 trading days)
Bullish scenario: If gold prices continue to rise after liquidity resumes in the US market and test 3489.78/3497.92 with a solid bullish candlestick, and the MACD histogram expands again and the RSI crosses 70 without a significant upward divergence, a move towards 3500 would not be surprising. A firm break above 3500 and confirmation by two or more hourly retracements would raise support to the 3497.92/3489.78 zone.
Bearish scenario: If pre-data position liquidation increases and gold prices directly touch the middle line of 3447.23, the quality of the backtest will need to be monitored. First, during the pullback, if the histogram clearly converges toward the zero axis and the RSI returns to the 55-60 range, it will be a benign decline. Second, if the middle line is broken and fails to stabilize at 3430/3400, the market will switch to high-level consolidation, with further pullbacks targeting 3396.54 and 3367.22. Short-term bearish space remains limited unless a combination of "macro negative factors and geopolitical easing" occurs.
Mid-term (within this month)
If the core narrative remains intact (expectations for rate cuts persist, the US dollar rebound is limited, and geopolitical risks haven't significantly eased), gold is more likely to maintain its upward trend. Even if data like NFP trigger short-term volatility, as long as the retracement doesn't break through the lower Bollinger Band and previous key lows, it could still rise in a step-by-step manner to refresh the upper limit of its historical range. Conversely, if data significantly beats expectations, the policy path is repriced, the US dollar strengthens, and geopolitical tensions decrease, gold could enter a cycle of "sideways trading at a high level, breaking through the lower band, and then switching trends."
Fundamentals: Expectations of interest rate cuts, a falling US dollar, and geopolitical uncertainty are positive.
Inflation and Policy Expectations: The US PCE price index remained at an annualized rate of 2.6% in July, while the core PCE rose slightly from 2.8% to 2.9%, in line with market expectations. Despite persistent inflationary pressures, the market continues to bet on the Federal Reserve cutting interest rates this month. CME FedWatch data shows an 87% probability of a 25 basis point rate cut this month, with at least one more cut expected this year. This combination mitigates the cost disadvantage of holding non-interest-bearing assets, providing medium-term support for gold.
Controversy over Federal Reserve independence: News reports indicate that US President Trump dismissed Governor Lisa Cook, who filed a lawsuit and refused to resign, raising concerns about the Fed's independence. If the Board of Governors were to undergo a restructuring, altering the voting majority structure, the market's confidence level on the policy path could widen. Increased US dollar volatility and rising safe-haven demand would indirectly benefit gold.
Geopolitical risks: The Russia-Ukraine conflict and the situation in the Middle East remain tense, strengthening the "risk-averse-hedge" logic and enhancing the risk hedging properties of gold.
Trading schedule and liquidity: The U.S. market is closed today for Labor Day, so trading volume may decline temporarily, and the risk of spreads and slippage will increase. The key data later this week is Friday's non-farm payrolls (NFP). Before that, funds are more inclined to fine-tune their positions based on policy expectations and geopolitical pulses.
Technical aspects:
The hourly chart shows a typical "strong trend + high-level consolidation" combination. Bollinger Bands indicate: middle band 3447.23, upper band 3497.92, and lower band 3396.54. The widening band indicates that trend momentum is still being released, but approaching the upper band is likely to trigger a mean reversion action of "intra-band retracement-mid-band retracement".
Regarding momentum indicators, the MACD shows a DIFF of 15.35, a DEA of 14.76, and a histogram of 1.18, all positive, but the bars are slightly narrower than before, signaling a "slowdown in high-level bullishness"—more of a rhythm adjustment than a trend reversal. The RSI (14) is at 67.19, below the overbought threshold of 70, reflecting strong but not extreme momentum.
Based on this, key short-term resistance lies at 3489.78 (current high) and 3497.92 (upper Bollinger band), with resistance above the 3500 round number. Support is expected at 3447.23 (middle Bollinger band/dynamic support), followed by static support near 3430 and 3400, as well as 3396.54 (lower Bollinger band) and 3367.22 (previous low/trend boundary). As long as the middle Bollinger band remains intact, the hourly rising channel remains valid, and the retest favors a healthy consolidation.
Market sentiment observation: Bullish sentiment prevails, but "don't chase highs" becomes the consensus
The current narrative is clear: rate cut expectations, a weak US dollar, and geopolitical uncertainty = a structurally bullish sentiment for gold. Meanwhile, hourly indicators are in a relatively bullish range, leading traders to be reluctant to chase prices near the upper band, preferring to wait for a pullback within the band and a cooling of indicators before re-entering the market. This has led to short-term tug-of-war and sideways trading. Overall, market sentiment is stable yet optimistic, with a strong consensus on buying safe-haven assets on dips, but also wary of data setbacks.
Market outlook: "trend first, rhythm first" as the main line
Short-term (1-3 trading days)
Bullish scenario: If gold prices continue to rise after liquidity resumes in the US market and test 3489.78/3497.92 with a solid bullish candlestick, and the MACD histogram expands again and the RSI crosses 70 without a significant upward divergence, a move towards 3500 would not be surprising. A firm break above 3500 and confirmation by two or more hourly retracements would raise support to the 3497.92/3489.78 zone.
Bearish scenario: If pre-data position liquidation increases and gold prices directly touch the middle line of 3447.23, the quality of the backtest will need to be monitored. First, during the pullback, if the histogram clearly converges toward the zero axis and the RSI returns to the 55-60 range, it will be a benign decline. Second, if the middle line is broken and fails to stabilize at 3430/3400, the market will switch to high-level consolidation, with further pullbacks targeting 3396.54 and 3367.22. Short-term bearish space remains limited unless a combination of "macro negative factors and geopolitical easing" occurs.
Mid-term (within this month)
If the core narrative remains intact (expectations for rate cuts persist, the US dollar rebound is limited, and geopolitical risks haven't significantly eased), gold is more likely to maintain its upward trend. Even if data like NFP trigger short-term volatility, as long as the retracement doesn't break through the lower Bollinger Band and previous key lows, it could still rise in a step-by-step manner to refresh the upper limit of its historical range. Conversely, if data significantly beats expectations, the policy path is repriced, the US dollar strengthens, and geopolitical tensions decrease, gold could enter a cycle of "sideways trading at a high level, breaking through the lower band, and then switching trends."
- Risk Warning and Disclaimer
- The market involves risk, and trading may not be suitable for all investors. This article is for reference only and does not constitute personal investment advice, nor does it take into account certain users’ specific investment objectives, financial situation, or other needs. Any investment decisions made based on this information are at your own risk.