Is gold on the offensive again after reaching its peak? A set of indicators tells you whether there is a second phase for the bulls.
2025-09-10 20:23:15
Spot gold strengthened again after a sharp rise and fall the previous day, fluctuating around $3,650 before the US market opened on Wednesday (September 10), with an intraday gain of approximately 0.65%. The market is focused on the US August Producer Price Index (PPI) release tonight at 8:30 PM. On a monthly basis, the consensus forecast for both the headline and core PPI is 0.3%, significantly lower than the unexpected 0.9% surge in July. On an annualized basis, the headline is expected to remain at 3.3%, while the core PPI may decline slightly from 3.7% to 3.5%. Thursday's CPI will be the final inflation checkpoint before the Federal Open Market Committee (FOMC) meeting.

The US Dollar Index (DXY) struggled near a seven-week low, with limited potential for a rebound, currently trading roughly sideways around 97.80. US Treasury yields fluctuated narrowly, with the 10-year yield at approximately 4.091%, the 30-year yield at approximately 4.747%, and the more policy-sensitive 2-year yield at around 3.548%. This combination of yields and a moderately weakening US dollar has reduced the opportunity cost of holding gold, providing underlying support for precious metals.
Geopolitically, localized risk premiums persist: Israel reportedly carried out airstrikes on targets in Doha on Tuesday, killing several senior members of the organization and a Qatari security guard; Poland intercepted a suspected Russian drone that entered its airspace at night. On the policy front, the US Supreme Court agreed to an expedited hearing in November on the president's tariff authority. An unfavorable ruling could lead to uncertainty surrounding large-scale tariff refunds. Furthermore, a federal judge ruled to block the removal of Federal Reserve Governor Lisa Cook, allowing her to vote on the FOMC next week. This combination of policy and legal uncertainty has increased demand for gold as a risk hedge and long-term asset allocation.
Overall, gold is supported by multiple factors: a weak dollar and yields, continued central bank buying of medium- and long-term assets, external costs and inflation repricing caused by tariff policy uncertainty, and ongoing geopolitical friction. In the short term, tonight's PPI and tomorrow's CPI will be the primary indicators, influencing the path of interest rate cuts after September.
The current 4-hour candlestick chart shows a high-level consolidation pattern following a standard ascending channel. Bollinger Bands remain open and rising, with the upper Bollinger Band at 3691.88, the middle Bollinger Band at 3606.83, and the lower Bollinger Band at 3521.78. The price is currently trading between the middle and upper Bollinger Bands at 3649.30, indicating that the trend has not been broken, but upward momentum has slightly weakened. Since 3551.15, the candlestick chart has been dominated by consecutive positive candlesticks, accompanied by short-term pullbacks, reaching a historical high at 3674.34. The price subsequently found support above the middle Bollinger Band, indicating that dynamic support near 3606.83 is valid.
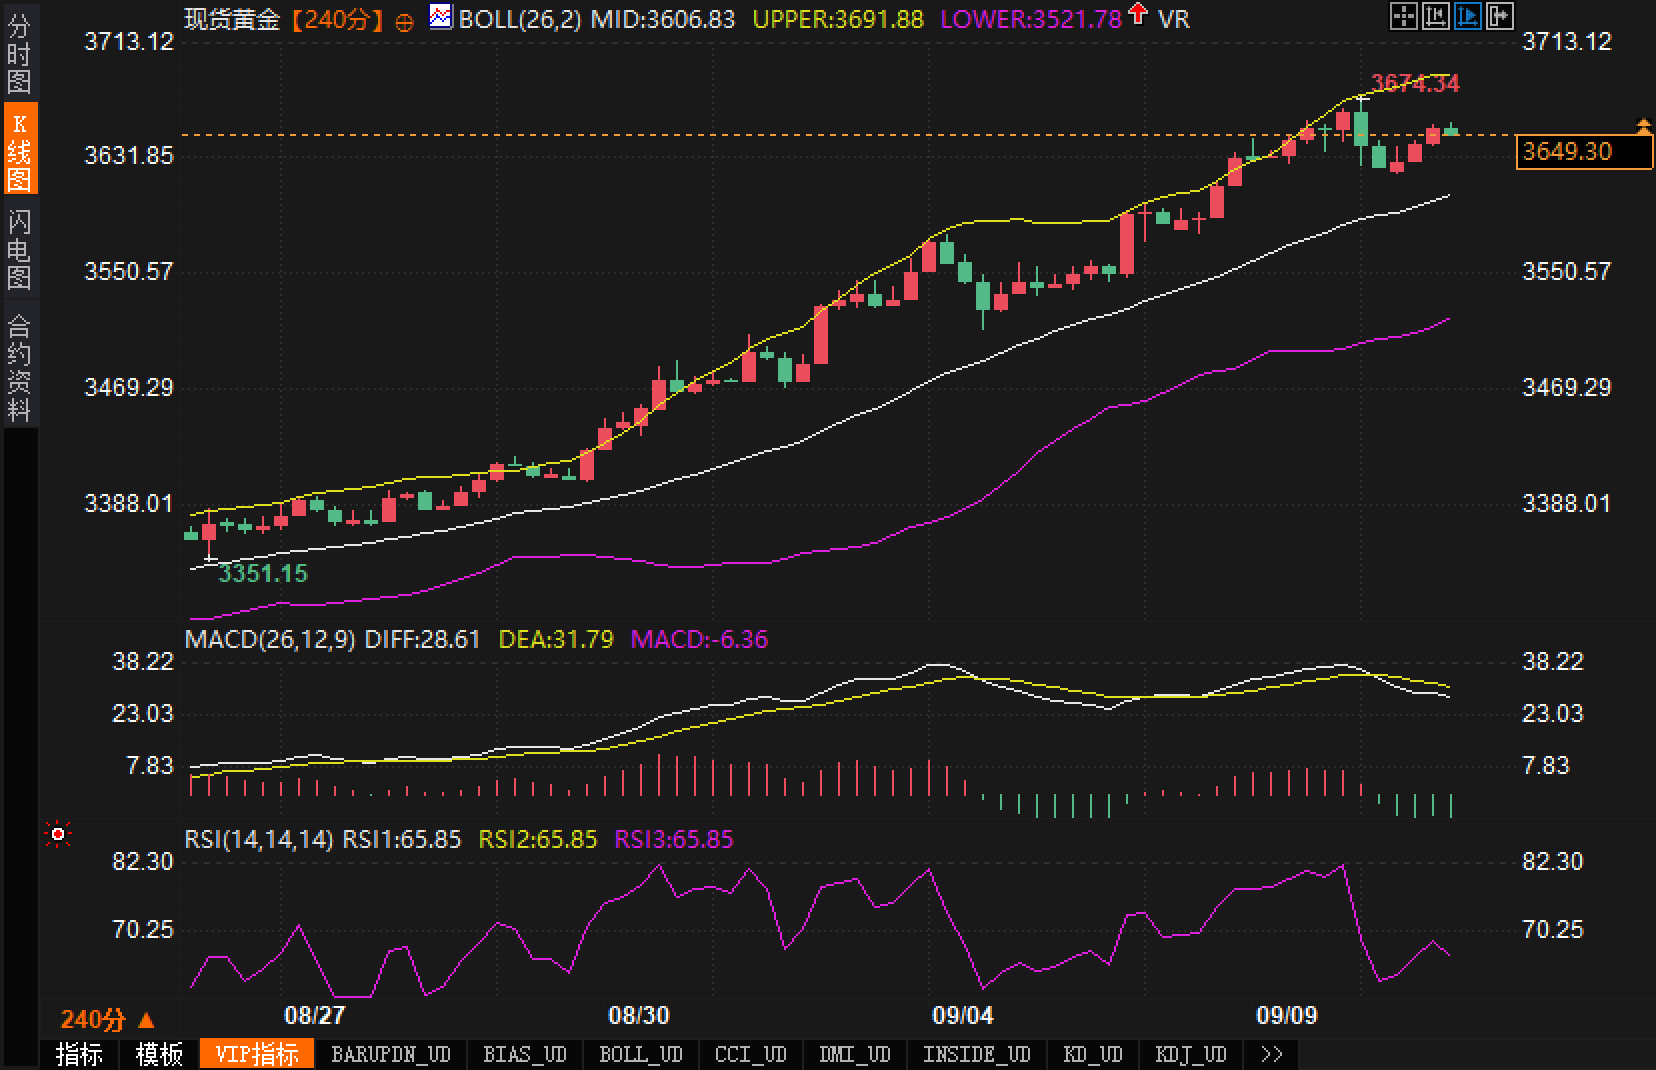
The MACD (Distribution Index) is 28.61, the Determinant Equation (DEA) is 31.79, and the histogram is -6.36, indicating a slight green continuation of a high-level death crossover—a typical pattern of strong divergence and digestion. This suggests that prices have not entered a downward trend, but rather are consolidating at high levels through time and small fluctuations to restore momentum. The Relative Strength Index (RSI 14) is at 65.85, indicating bullish but not overheated territory, with room to move above the overbought threshold.
Overall conclusion: As long as the price remains above the middle Bollinger band at 3606.83, the trend remains upward. If it breaks above 3674.34 on strong volume, there is a chance for a second attempt at 3691.88 or even the psychological barrier of 3700. Conversely, if it breaks below 3606.83 and confirms a break, it is likely to retest the strong support around 3521.78-3550.
Long scenario (trend continuation):
1) If the PPI and CPI decline as expected, or even weaken further, and the US dollar and US Treasury yields continue to decline or trade sideways, gold could see a second leg higher. Upward resistance lies at 3674.34 (historical high), 3691.88 (upper Bollinger Band), and 3700 (the psychological round number). A breakout with consistent volume and price action could signal an acceleration in the upward trend, followed by a potential shift to a high flag/rectangular consolidation pattern.
2) From a medium- to long-term perspective, central bank allocations and geopolitical uncertainties continue to attract risk-neutral funds for gold. If policy expectations turn to a more relaxed stance, the three factors of gold, namely, interest rates, growth, and inflation, will maintain a positive weight, and any pullback will mostly be achieved by trading time for space.
Short-selling scenario (strong correction/retracement extension):
1) If inflation data unexpectedly strengthens or policy guidance becomes more hawkish, the dollar and yields rebound simultaneously, and gold could experience a false breakout followed by a dip. The key level to watch is 3606.83 (the middle Bollinger band). If this level falls and trading volume increases, a retracement target could be the lower Bollinger band between 3550 and 3521.78.
2) If geopolitical risks ease in the short term, legal and policy uncertainties decrease temporarily, and safe-haven demand declines, gold may enter a "high-level box-mean reversion" phase, using sideways trading to digest previous gains and reduce volatility.
Fundamentals
The US Dollar Index (DXY) struggled near a seven-week low, with limited potential for a rebound, currently trading roughly sideways around 97.80. US Treasury yields fluctuated narrowly, with the 10-year yield at approximately 4.091%, the 30-year yield at approximately 4.747%, and the more policy-sensitive 2-year yield at around 3.548%. This combination of yields and a moderately weakening US dollar has reduced the opportunity cost of holding gold, providing underlying support for precious metals.
Geopolitically, localized risk premiums persist: Israel reportedly carried out airstrikes on targets in Doha on Tuesday, killing several senior members of the organization and a Qatari security guard; Poland intercepted a suspected Russian drone that entered its airspace at night. On the policy front, the US Supreme Court agreed to an expedited hearing in November on the president's tariff authority. An unfavorable ruling could lead to uncertainty surrounding large-scale tariff refunds. Furthermore, a federal judge ruled to block the removal of Federal Reserve Governor Lisa Cook, allowing her to vote on the FOMC next week. This combination of policy and legal uncertainty has increased demand for gold as a risk hedge and long-term asset allocation.
Overall, gold is supported by multiple factors: a weak dollar and yields, continued central bank buying of medium- and long-term assets, external costs and inflation repricing caused by tariff policy uncertainty, and ongoing geopolitical friction. In the short term, tonight's PPI and tomorrow's CPI will be the primary indicators, influencing the path of interest rate cuts after September.
Technical aspects:
The current 4-hour candlestick chart shows a high-level consolidation pattern following a standard ascending channel. Bollinger Bands remain open and rising, with the upper Bollinger Band at 3691.88, the middle Bollinger Band at 3606.83, and the lower Bollinger Band at 3521.78. The price is currently trading between the middle and upper Bollinger Bands at 3649.30, indicating that the trend has not been broken, but upward momentum has slightly weakened. Since 3551.15, the candlestick chart has been dominated by consecutive positive candlesticks, accompanied by short-term pullbacks, reaching a historical high at 3674.34. The price subsequently found support above the middle Bollinger Band, indicating that dynamic support near 3606.83 is valid.
The MACD (Distribution Index) is 28.61, the Determinant Equation (DEA) is 31.79, and the histogram is -6.36, indicating a slight green continuation of a high-level death crossover—a typical pattern of strong divergence and digestion. This suggests that prices have not entered a downward trend, but rather are consolidating at high levels through time and small fluctuations to restore momentum. The Relative Strength Index (RSI 14) is at 65.85, indicating bullish but not overheated territory, with room to move above the overbought threshold.
Overall conclusion: As long as the price remains above the middle Bollinger band at 3606.83, the trend remains upward. If it breaks above 3674.34 on strong volume, there is a chance for a second attempt at 3691.88 or even the psychological barrier of 3700. Conversely, if it breaks below 3606.83 and confirms a break, it is likely to retest the strong support around 3521.78-3550.
Market outlook:
Long scenario (trend continuation):
1) If the PPI and CPI decline as expected, or even weaken further, and the US dollar and US Treasury yields continue to decline or trade sideways, gold could see a second leg higher. Upward resistance lies at 3674.34 (historical high), 3691.88 (upper Bollinger Band), and 3700 (the psychological round number). A breakout with consistent volume and price action could signal an acceleration in the upward trend, followed by a potential shift to a high flag/rectangular consolidation pattern.
2) From a medium- to long-term perspective, central bank allocations and geopolitical uncertainties continue to attract risk-neutral funds for gold. If policy expectations turn to a more relaxed stance, the three factors of gold, namely, interest rates, growth, and inflation, will maintain a positive weight, and any pullback will mostly be achieved by trading time for space.
Short-selling scenario (strong correction/retracement extension):
1) If inflation data unexpectedly strengthens or policy guidance becomes more hawkish, the dollar and yields rebound simultaneously, and gold could experience a false breakout followed by a dip. The key level to watch is 3606.83 (the middle Bollinger band). If this level falls and trading volume increases, a retracement target could be the lower Bollinger band between 3550 and 3521.78.
2) If geopolitical risks ease in the short term, legal and policy uncertainties decrease temporarily, and safe-haven demand declines, gold may enter a "high-level box-mean reversion" phase, using sideways trading to digest previous gains and reduce volatility.
- Risk Warning and Disclaimer
- The market involves risk, and trading may not be suitable for all investors. This article is for reference only and does not constitute personal investment advice, nor does it take into account certain users’ specific investment objectives, financial situation, or other needs. Any investment decisions made based on this information are at your own risk.