The US Treasury bond liquidity pump is fully operational! Where will this extreme stress test of the Federal Reserve push the US dollar?
2025-09-12 19:38:53
On Friday (September 12), the U.S. Treasury market showed signs of a cautious recovery, with the 10-year yield at 4.036%, up 0.32% on the day and rebounding from the previous day's low of 3.988%, but still hovering around the 4% mark. The U.S. dollar index rose slightly by 0.14% to 97.6579, still within reach of its recent low of 96.3729, but failing to break through its previous high of 98.8487.
The overall market sentiment resembles a tug-of-war: Expectations of a rate cut at next week's Federal Reserve meeting loom large, coupled with concerns about liquidity in September, leaving the U.S. Treasury curve oscillating between short-term relief and long-term pressure. Some traders have bluntly stated that this week's bond market volatility "seems to be testing the Fed's bottom line," while the dollar's resilience is being interpreted as a "temporary retreat of safe-haven funds."
From a broader perspective, the weak employment data at the beginning of this week - with new jobs far below expectations - directly ignited market bets on the Federal Reserve restarting its easing policy. The futures market has priced the probability of a 25 basis point rate cut next week to be almost certain, and the 50 basis point "feast" only has a 10% chance. A report from a well-known institution pointed out that this expectation is gradually being transmitted from the short end to the long end, but the liquidity withdrawal effect brought about by the wave of government bond issuance has made bond market investors wary. Recalling that after the debt ceiling was raised last month, the pace of government borrowing accelerated. Although the size of bank reserves is higher than the peak tightening period in 2019, the use of RRP tools has been halved from US$2.6 trillion to US$29 billion. A senior strategist commented: "September always has a sense of restlessness. The bet on the steepening of the bond market curve is now whether the Federal Reserve will take early action to stabilize the level."
As for the US dollar, the slight rise in the index isn't a sign of a strong comeback, but rather a relative support for non-US currencies. While the Euro and British Pound retreated slightly, the weakening of safe-haven assets like the Japanese Yen and Canadian Dollar underscored the market's sensitivity to diverging global policies. Overall, this week's market action closely resembled a "mirror game" between the bond market and the US dollar: every point lower in yields provides the US dollar with a breather, but if liquidity signals tighten, the chain reaction will rapidly amplify . This sets the stage for next week's market trends—the Fed's dot plot and the Chairman's speech will directly test the bond market's ability to withstand pressure.
Starting next week, the U.S. Treasury market will face a quarter-end liquidity test . This will not only involve technical fluctuations but also serve as a litmus test for the intertwined fundamentals and policies. Treasury issuance has expanded sharply in recent months, and since the debt ceiling increase in July, net supply has heightened traders' vigilance regarding funding pools. Analysts from prominent institutions emphasized in a report that this surge in borrowing often coincides with a decline in demand for overnight reverse repos by the Federal Reserve, putting pressure on bank reserves—projected to fall below $3 trillion by the end of September. Signs of this are already evident in the repo market: Last Friday, the overnight funding rate (SOFR) for Treasury bonds rose to 4.42%, a two-month high. Although it fell slightly to 4.39% on Thursday, the one-month SOFR forward rate spread over the federal funds rate has reached a record low of -7.5 basis points. This suggests that the market anticipates tighter financing conditions at the end of the quarter , squeezing the low-risk premium offered by collateralized bonds.
This liquidity drain isn't an isolated incident. The Federal Reserve has been shrinking its balance sheet for over three years, shrinking it from its peak. Combined with the quarterly deadlines for corporate tax payments and coupon settlements, the situation could easily repeat the "funding crunch" of September 2019. Back then, a sharp decline in bank reserves caused repo rates to spike, a situation only alleviated by the Fed's liquidity injections. A short-term strategist's widely shared view: "Technical factors combined with the tax rush make September a tightrope walk—the Fed's Standing Repo Facility (SRF) is a safety net, but who knows if it will be enough?" While bank reserves are currently significantly higher than in 2019, the halving of reserve requirements (RRPs) has made liquidity a key variable in the bond market. A Citigroup report further notes that as Treasury bill supply increases, bank reserves will continue to decline, making the risk of a tightening this month significant.
From the perspective of the US dollar, these liquidity pressures are a double-edged sword. On the one hand, if bond market volatility triggers risk aversion, funds will flock to the US dollar as a safe haven, supporting the index's stability. On the other hand, if yields unexpectedly rise due to oversupply, the US dollar's interest rate support will be strengthened, but this could also increase financing costs and indirectly drag down economic growth expectations. Some have likened this to a "domino effect in the bond market": the negative SOFR spread signals a tightening of repo conditions, potentially forcing the Federal Reserve to deliver more dovish signals at next week's meeting. Overall, September's label as a "stress month" has firmly stuck, and bond investors are closely monitoring these indicators, as any unexpected tightening could trigger a chain reaction sell-off.
Trump's tariff rhetoric once again rattled markets this week. While the details haven't been fully scrutinized, the concerns it sparked have permeated bond market pricing. Leading portfolio managers say the rhetoric has heightened fiscal deficit concerns and increased investor sensitivity to long-term yields. Market discussion is focused on this: " The tariff crisis has created multiple layers of uncertainty in the bond market —safe-haven buying is underway, but what about the supply side?" This, combined with ongoing uncertainty surrounding the Russia-Ukraine situation, has further reinforced the bond market's defensive stance.
Turning to the technicals, the daily chart of US Treasury yields shows clear downward momentum, but support levels will be more challenging next week. The 10-year yield, currently at 4.036%, rose 0.32% on the day, but remains below both its 50-day moving average of 4.340 and its 100-day moving average of 4.353. The previous low of 3.988% remains in sharp focus, while the previous high of 4.352% represents a short-term ceiling. The MACD indicators (12, 26, 9) show a DIFF of -0.019, a DEA of -0.026, and a histogram of 0.015. While the DIFF line crosses above the DEA line, the positive histogram has limited strength, suggesting a pause in downward momentum rather than a reversal. This is consistent with the overall flattening of the yield curve: the short end is benefiting from downward pressure from expectations of rate cuts, while the long end is supported by supply and fiscal concerns . The mid-range 5-7 year yields are lagging, widening the yield spread to a recent steepest 1.25%.
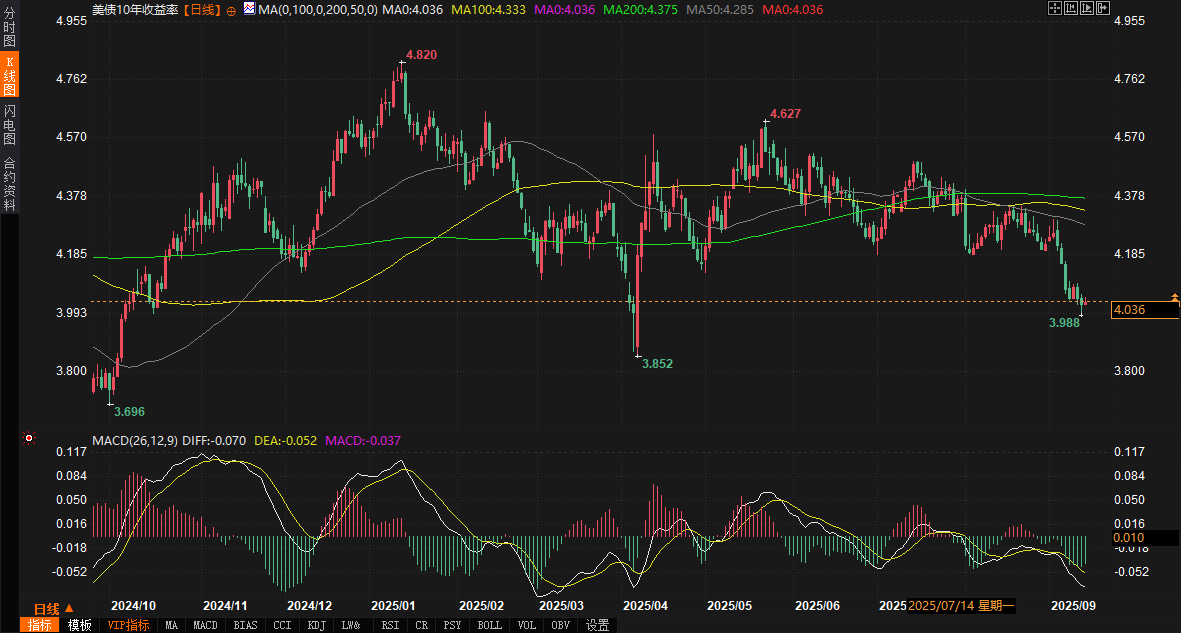
Technical analysts shared this view. One chartist noted, "The weak positive turn in the bond market's MACD seems to be giving yields a breather, but if the low of 3.988% before the quarter-end is breached, the curve flattening will accelerate." Historically, yields under similar allocations tend to bottom out and rebound before the end of the quarter, but the current decline in reserves limits the potential for a rebound. The 30-year yield fell to a six-month low of 4.35%, further demonstrating the lead of long-dated bonds. Auction demand was strong, with a bid-to-cover ratio of 2.58 above average, indicating a clear influx of safe-haven funds.
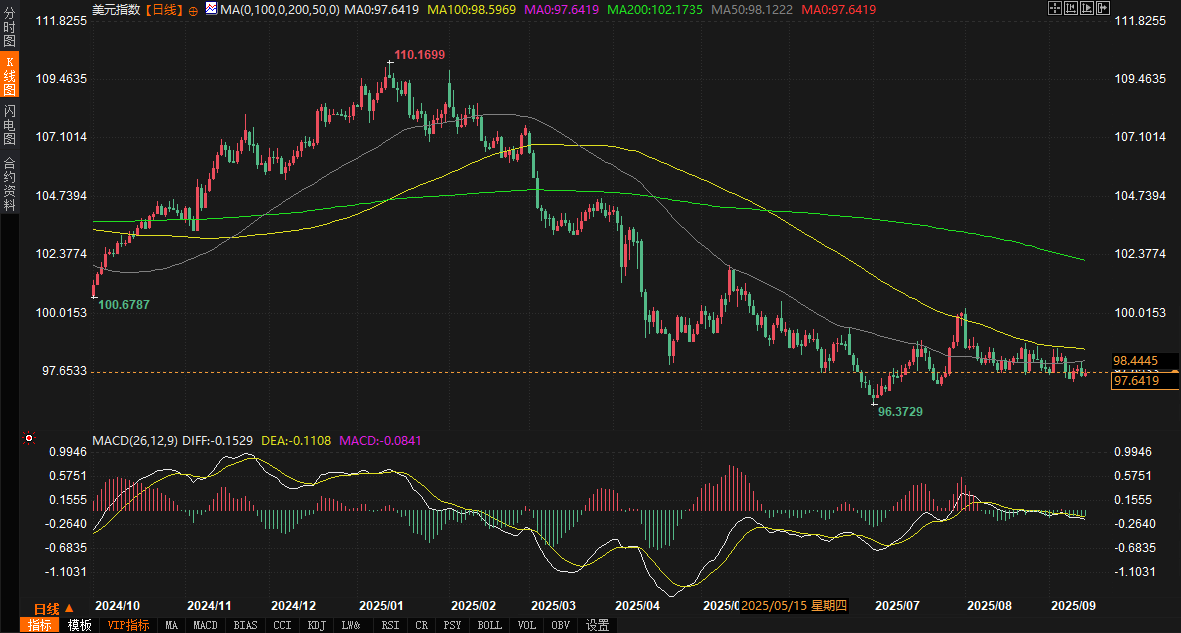
The technical picture for the US dollar index is even more tangled. At 97.6579 on the daily chart, after a 0.14% increase, the 50-day moving average at 98.1225 is acting as near-term resistance. The 100-day moving average at 98.5970 and the 200-day moving average at 102.1736 are significantly above. The previous low of 96.3729 provides a buffer, while the previous high of 98.8487 awaits a breakthrough. The MACD (12, 26, 9) DIFF at -0.1528, DEA at -0.1108, and histogram at -0.0841—all negative—indicate a bearish trend, but the convergence of the DIFF and DEA suggests a potential turning point. If bond yields hold above 4%, the dollar's relative strength may continue; conversely, a test of support at 96.37 would increase the potential for a rebound in non-US currencies. A forex expert commented, "Although the dollar's MACD has deep negative histograms, the flattening of the bond curve is its hidden anchor— as liquidity tightens, the index gains resilience ."
These technical signals aren't isolated. Next week, the steepening of the bond curve will be driven by falling short-term interest rates. As one chief investment officer noted in a report, " The next phase of the yield curve isn't a sell-off in long-term bonds, but rather a resumption of the Fed's rate-cutting cycle ." Combined with futures pricing, at least 75 basis points of easing by year-end is already priced in. Technically, the relentless pressure from moving averages and the convergence of the MACD suggest a volatile market for early next week: yields may consolidate in the 4.00%-4.05% range, while the US dollar index will fluctuate between 97.50 and 98.00. Notably, the VIX index remains in the bullish range of 14.98, with small-cap stocks leading the gains, indirectly supporting defensive positions in the bond market.
Looking ahead to next week, the U.S. Treasury market will face a high-density event window, with the dual tests of liquidity and policy signals likely to dominate the market. The Federal Reserve's meeting on Tuesday and Wednesday will be the focus, with a 25 basis point rate cut almost certain. However, if the dot plot indicates a further easing path through 2026, long-term yields may continue to test lower levels, accelerating the flattening of the curve . Under quarter-end funding pressure, if the negative SOFR spread widens, the tightening of the repo market will amplify volatility, and the 10-year yield may fluctuate between 3.99% and 4.10%, with the previous low of 3.988% becoming a key line of defense. The views of well-known strategists are echoed here: "When risks are fully priced in, markets rarely crash, but the volatility in September always exceeds expectations."
The US dollar index faces a test of bond market transmission. Falling yields will weaken its interest rate advantage, and the index could dip to around 97.00. However, if risk aversion intensifies due to tariff rhetoric or escalating tensions between Russia and Ukraine, the 96.37 support level will likely hold. The consensus is: " The dollar's bottom lies in the bond market . With the Fed's dovish stance, the index is likely to hold above 97, but if a surge in supply pushes yields higher, there is room for a rebound." Overall, the long-term bond market is likely to lead the decline, while the dollar is likely to bottom out in the 97-98 range. Every change in liquidity indicators could trigger a wave of volatility. The market is like a chess game, and next week's moves will reshape the rhythm of autumn.
The overall market sentiment resembles a tug-of-war: Expectations of a rate cut at next week's Federal Reserve meeting loom large, coupled with concerns about liquidity in September, leaving the U.S. Treasury curve oscillating between short-term relief and long-term pressure. Some traders have bluntly stated that this week's bond market volatility "seems to be testing the Fed's bottom line," while the dollar's resilience is being interpreted as a "temporary retreat of safe-haven funds."
From a broader perspective, the weak employment data at the beginning of this week - with new jobs far below expectations - directly ignited market bets on the Federal Reserve restarting its easing policy. The futures market has priced the probability of a 25 basis point rate cut next week to be almost certain, and the 50 basis point "feast" only has a 10% chance. A report from a well-known institution pointed out that this expectation is gradually being transmitted from the short end to the long end, but the liquidity withdrawal effect brought about by the wave of government bond issuance has made bond market investors wary. Recalling that after the debt ceiling was raised last month, the pace of government borrowing accelerated. Although the size of bank reserves is higher than the peak tightening period in 2019, the use of RRP tools has been halved from US$2.6 trillion to US$29 billion. A senior strategist commented: "September always has a sense of restlessness. The bet on the steepening of the bond market curve is now whether the Federal Reserve will take early action to stabilize the level."
As for the US dollar, the slight rise in the index isn't a sign of a strong comeback, but rather a relative support for non-US currencies. While the Euro and British Pound retreated slightly, the weakening of safe-haven assets like the Japanese Yen and Canadian Dollar underscored the market's sensitivity to diverging global policies. Overall, this week's market action closely resembled a "mirror game" between the bond market and the US dollar: every point lower in yields provides the US dollar with a breather, but if liquidity signals tighten, the chain reaction will rapidly amplify . This sets the stage for next week's market trends—the Fed's dot plot and the Chairman's speech will directly test the bond market's ability to withstand pressure.
Liquidity concerns dominate: Multiple sources of pressure in the bond market in September
Starting next week, the U.S. Treasury market will face a quarter-end liquidity test . This will not only involve technical fluctuations but also serve as a litmus test for the intertwined fundamentals and policies. Treasury issuance has expanded sharply in recent months, and since the debt ceiling increase in July, net supply has heightened traders' vigilance regarding funding pools. Analysts from prominent institutions emphasized in a report that this surge in borrowing often coincides with a decline in demand for overnight reverse repos by the Federal Reserve, putting pressure on bank reserves—projected to fall below $3 trillion by the end of September. Signs of this are already evident in the repo market: Last Friday, the overnight funding rate (SOFR) for Treasury bonds rose to 4.42%, a two-month high. Although it fell slightly to 4.39% on Thursday, the one-month SOFR forward rate spread over the federal funds rate has reached a record low of -7.5 basis points. This suggests that the market anticipates tighter financing conditions at the end of the quarter , squeezing the low-risk premium offered by collateralized bonds.
This liquidity drain isn't an isolated incident. The Federal Reserve has been shrinking its balance sheet for over three years, shrinking it from its peak. Combined with the quarterly deadlines for corporate tax payments and coupon settlements, the situation could easily repeat the "funding crunch" of September 2019. Back then, a sharp decline in bank reserves caused repo rates to spike, a situation only alleviated by the Fed's liquidity injections. A short-term strategist's widely shared view: "Technical factors combined with the tax rush make September a tightrope walk—the Fed's Standing Repo Facility (SRF) is a safety net, but who knows if it will be enough?" While bank reserves are currently significantly higher than in 2019, the halving of reserve requirements (RRPs) has made liquidity a key variable in the bond market. A Citigroup report further notes that as Treasury bill supply increases, bank reserves will continue to decline, making the risk of a tightening this month significant.
From the perspective of the US dollar, these liquidity pressures are a double-edged sword. On the one hand, if bond market volatility triggers risk aversion, funds will flock to the US dollar as a safe haven, supporting the index's stability. On the other hand, if yields unexpectedly rise due to oversupply, the US dollar's interest rate support will be strengthened, but this could also increase financing costs and indirectly drag down economic growth expectations. Some have likened this to a "domino effect in the bond market": the negative SOFR spread signals a tightening of repo conditions, potentially forcing the Federal Reserve to deliver more dovish signals at next week's meeting. Overall, September's label as a "stress month" has firmly stuck, and bond investors are closely monitoring these indicators, as any unexpected tightening could trigger a chain reaction sell-off.
Trump's tariff rhetoric once again rattled markets this week. While the details haven't been fully scrutinized, the concerns it sparked have permeated bond market pricing. Leading portfolio managers say the rhetoric has heightened fiscal deficit concerns and increased investor sensitivity to long-term yields. Market discussion is focused on this: " The tariff crisis has created multiple layers of uncertainty in the bond market —safe-haven buying is underway, but what about the supply side?" This, combined with ongoing uncertainty surrounding the Russia-Ukraine situation, has further reinforced the bond market's defensive stance.
Technical signals: The subtle game between the bond market curve and the US dollar index
Turning to the technicals, the daily chart of US Treasury yields shows clear downward momentum, but support levels will be more challenging next week. The 10-year yield, currently at 4.036%, rose 0.32% on the day, but remains below both its 50-day moving average of 4.340 and its 100-day moving average of 4.353. The previous low of 3.988% remains in sharp focus, while the previous high of 4.352% represents a short-term ceiling. The MACD indicators (12, 26, 9) show a DIFF of -0.019, a DEA of -0.026, and a histogram of 0.015. While the DIFF line crosses above the DEA line, the positive histogram has limited strength, suggesting a pause in downward momentum rather than a reversal. This is consistent with the overall flattening of the yield curve: the short end is benefiting from downward pressure from expectations of rate cuts, while the long end is supported by supply and fiscal concerns . The mid-range 5-7 year yields are lagging, widening the yield spread to a recent steepest 1.25%.
Technical analysts shared this view. One chartist noted, "The weak positive turn in the bond market's MACD seems to be giving yields a breather, but if the low of 3.988% before the quarter-end is breached, the curve flattening will accelerate." Historically, yields under similar allocations tend to bottom out and rebound before the end of the quarter, but the current decline in reserves limits the potential for a rebound. The 30-year yield fell to a six-month low of 4.35%, further demonstrating the lead of long-dated bonds. Auction demand was strong, with a bid-to-cover ratio of 2.58 above average, indicating a clear influx of safe-haven funds.
The technical picture for the US dollar index is even more tangled. At 97.6579 on the daily chart, after a 0.14% increase, the 50-day moving average at 98.1225 is acting as near-term resistance. The 100-day moving average at 98.5970 and the 200-day moving average at 102.1736 are significantly above. The previous low of 96.3729 provides a buffer, while the previous high of 98.8487 awaits a breakthrough. The MACD (12, 26, 9) DIFF at -0.1528, DEA at -0.1108, and histogram at -0.0841—all negative—indicate a bearish trend, but the convergence of the DIFF and DEA suggests a potential turning point. If bond yields hold above 4%, the dollar's relative strength may continue; conversely, a test of support at 96.37 would increase the potential for a rebound in non-US currencies. A forex expert commented, "Although the dollar's MACD has deep negative histograms, the flattening of the bond curve is its hidden anchor— as liquidity tightens, the index gains resilience ."
These technical signals aren't isolated. Next week, the steepening of the bond curve will be driven by falling short-term interest rates. As one chief investment officer noted in a report, " The next phase of the yield curve isn't a sell-off in long-term bonds, but rather a resumption of the Fed's rate-cutting cycle ." Combined with futures pricing, at least 75 basis points of easing by year-end is already priced in. Technically, the relentless pressure from moving averages and the convergence of the MACD suggest a volatile market for early next week: yields may consolidate in the 4.00%-4.05% range, while the US dollar index will fluctuate between 97.50 and 98.00. Notably, the VIX index remains in the bullish range of 14.98, with small-cap stocks leading the gains, indirectly supporting defensive positions in the bond market.
Next week's outlook: Bond market volatility intensifies, the US dollar is under pressure and looking for a bottom
Looking ahead to next week, the U.S. Treasury market will face a high-density event window, with the dual tests of liquidity and policy signals likely to dominate the market. The Federal Reserve's meeting on Tuesday and Wednesday will be the focus, with a 25 basis point rate cut almost certain. However, if the dot plot indicates a further easing path through 2026, long-term yields may continue to test lower levels, accelerating the flattening of the curve . Under quarter-end funding pressure, if the negative SOFR spread widens, the tightening of the repo market will amplify volatility, and the 10-year yield may fluctuate between 3.99% and 4.10%, with the previous low of 3.988% becoming a key line of defense. The views of well-known strategists are echoed here: "When risks are fully priced in, markets rarely crash, but the volatility in September always exceeds expectations."
The US dollar index faces a test of bond market transmission. Falling yields will weaken its interest rate advantage, and the index could dip to around 97.00. However, if risk aversion intensifies due to tariff rhetoric or escalating tensions between Russia and Ukraine, the 96.37 support level will likely hold. The consensus is: " The dollar's bottom lies in the bond market . With the Fed's dovish stance, the index is likely to hold above 97, but if a surge in supply pushes yields higher, there is room for a rebound." Overall, the long-term bond market is likely to lead the decline, while the dollar is likely to bottom out in the 97-98 range. Every change in liquidity indicators could trigger a wave of volatility. The market is like a chess game, and next week's moves will reshape the rhythm of autumn.
- Risk Warning and Disclaimer
- The market involves risk, and trading may not be suitable for all investors. This article is for reference only and does not constitute personal investment advice, nor does it take into account certain users’ specific investment objectives, financial situation, or other needs. Any investment decisions made based on this information are at your own risk.