Is the Fed unable to save the economy? Has the yield curve long been "broken"? Are the economic signals all smoke and mirrors?
2025-09-17 21:54:04
In recent years, an inverted U.S. Treasury yield curve has not necessarily signaled an impending recession. Similarly, the current upward-sloping yield curve, which has emerged from its inversion, does not provide a guarantee of strong economic growth. The yield curve refers to the difference in interest rates between Treasury bonds of different maturities (short-term and long-term).
Typically, short-term Treasury bond yields (such as the 2-year Treasury yield) are lower than long-term Treasury bond yields (such as the 10-year Treasury yield). However, the market often experiences a "yield curve inversion"—a reversal of the relationship between long-term and short-term interest rates. Historically, this has been a reliable warning sign of an approaching recession.
However, this principle has broken down in recent years. When analyzing the Federal Reserve's upcoming interest rate decision, it's crucial to focus on this historical trend: while this decision will likely push the yield curve further upward, it doesn't necessarily mean the economic outlook has materially improved.
The U.S. Treasury yield curve began inverting in 2022, reaching its maximum inversion in July 2023, and only ended earlier this year. During this nearly three-year inversion, many financial analysts, based on the slope of the yield curve, almost certainly predicted an impending recession, but ultimately failed to do so.
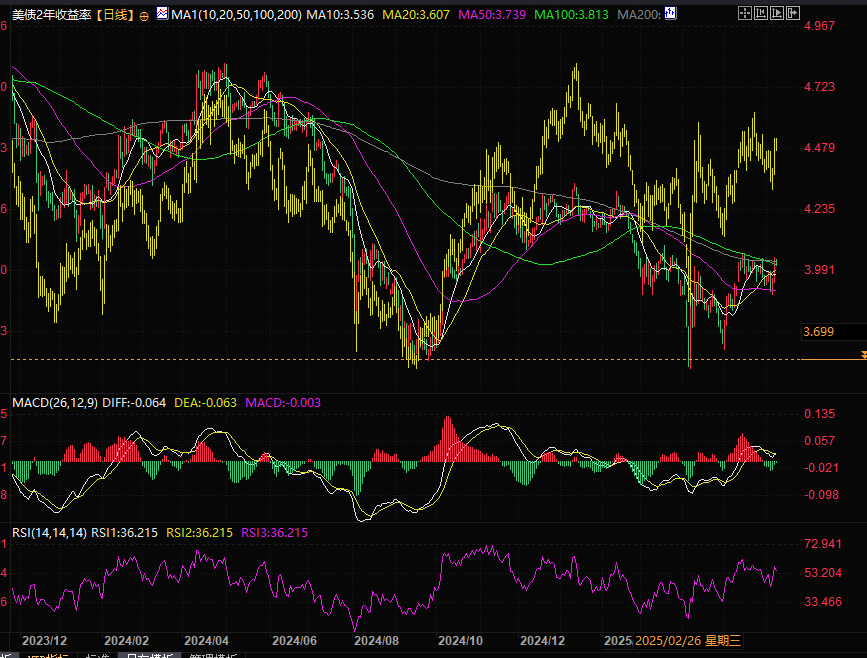
(2. Overlay chart of 10-year U.S. Treasury bond yields)
During the period when the long-term and short-term U.S. Treasury yields inverted, U.S. economic and labor data showed no signs of slowing down.
If we exclude the factor of economic strength, why does the yield curve only show an upward slope at the long end? Although it is difficult to accurately identify the core problem, the underlying factors may include the following:
The Fed's weakened independence is exacerbating inflation concerns : President Donald Trump's recent continued pressure on the Federal Reserve's interest rate-setting committee has significantly increased the risk that future interest rates will be influenced by political factors. All else being equal, the Fed's weakened independence is bound to push up long-term interest rates because it will significantly increase market uncertainty about the Fed's policy response to future inflationary pressures.
The potential risk of some U.S. Treasuries being converted to zero-coupon bonds : This refers to the proposals in the so-called Mar-a-Lago agreement, which was primarily spearheaded by current Federal Reserve Board Governor Stephen Milan. One key proposal is to convert U.S. Treasury bonds held by foreign central banks into zero-coupon bonds with maturities of 50 or 100 years. While this move would not directly affect non-central bank holdings of U.S. Treasuries, it would have a significant indirect impact if foreign central banks sold off U.S. Treasuries prematurely to avoid the risk of being forced to accept zero interest rates in the future. The prospect of such a sell-off alone could be enough to push long-term interest rates upward.
The objectivity of the U.S. Bureau of Labor Statistics (BLS) has been challenged . The BLS is the official agency responsible for calculating domestic inflation and unemployment rates. Trump's dismissal of the agency's head in early August has sparked market concerns that future data calculations may be tainted with political bias. This will exacerbate market confusion regarding the "true level of inflation," further forcing long-term U.S. Treasury bond yields to steepen.
The "convenience yield" has completely disappeared : the U.S. Treasury yield has always had an excess return relative to the assumed risk-free rate. Since U.S. Treasury bonds are the most traded and easiest to buy and sell assets in the world, they can be converted into cash instantly when the market panics (such as the financial crisis) or when cash is urgently needed, with almost no discount. This characteristic makes it possible to calculate that there has always been an excess return for holding U.S. Treasury bonds compared with other countries' government bonds. However, this phenomenon has now disappeared and the excess return is even negative, and the convenience yield has completely disappeared.
The so-called "convenience yield," the excess return on U.S. Treasury bonds relative to the assumed risk-free rate, has not only disappeared in recent years but has even turned negative. This convenience yield on U.S. Treasury bonds exists during both economic upturns and downturns, making it irrelevant to long-term economic growth prospects.
Finally, declining U.S. labor data and rising inflation expectations due to tariffs have heightened concerns about stagflation in the U.S. economy. In addition, both Europe and Japan have experienced a sell-off of long-term government bonds, which has impacted the selling of U.S. government bonds and the possibility that the interest rate curve will steepen.
Ultimately, the slope of the yield curve has lost its previous signaling significance. In the current market environment, it has become, to a certain extent, a core barometer of the bond market's confidence in the implementation of monetary policy. Therefore, future signals from the U.S. Treasury yield curve that appear to point to positive economic activity may actually harbor deeper implications.
Typically, short-term Treasury bond yields (such as the 2-year Treasury yield) are lower than long-term Treasury bond yields (such as the 10-year Treasury yield). However, the market often experiences a "yield curve inversion"—a reversal of the relationship between long-term and short-term interest rates. Historically, this has been a reliable warning sign of an approaching recession.
However, this principle has broken down in recent years. When analyzing the Federal Reserve's upcoming interest rate decision, it's crucial to focus on this historical trend: while this decision will likely push the yield curve further upward, it doesn't necessarily mean the economic outlook has materially improved.
The U.S. Treasury yield curve began inverting in 2022, reaching its maximum inversion in July 2023, and only ended earlier this year. During this nearly three-year inversion, many financial analysts, based on the slope of the yield curve, almost certainly predicted an impending recession, but ultimately failed to do so.
(2. Overlay chart of 10-year U.S. Treasury bond yields)
During the period when the long-term and short-term U.S. Treasury yields inverted, U.S. economic and labor data showed no signs of slowing down.
If we exclude the factor of economic strength, why does the yield curve only show an upward slope at the long end? Although it is difficult to accurately identify the core problem, the underlying factors may include the following:
The Fed's weakened independence is exacerbating inflation concerns : President Donald Trump's recent continued pressure on the Federal Reserve's interest rate-setting committee has significantly increased the risk that future interest rates will be influenced by political factors. All else being equal, the Fed's weakened independence is bound to push up long-term interest rates because it will significantly increase market uncertainty about the Fed's policy response to future inflationary pressures.
The potential risk of some U.S. Treasuries being converted to zero-coupon bonds : This refers to the proposals in the so-called Mar-a-Lago agreement, which was primarily spearheaded by current Federal Reserve Board Governor Stephen Milan. One key proposal is to convert U.S. Treasury bonds held by foreign central banks into zero-coupon bonds with maturities of 50 or 100 years. While this move would not directly affect non-central bank holdings of U.S. Treasuries, it would have a significant indirect impact if foreign central banks sold off U.S. Treasuries prematurely to avoid the risk of being forced to accept zero interest rates in the future. The prospect of such a sell-off alone could be enough to push long-term interest rates upward.
The objectivity of the U.S. Bureau of Labor Statistics (BLS) has been challenged . The BLS is the official agency responsible for calculating domestic inflation and unemployment rates. Trump's dismissal of the agency's head in early August has sparked market concerns that future data calculations may be tainted with political bias. This will exacerbate market confusion regarding the "true level of inflation," further forcing long-term U.S. Treasury bond yields to steepen.
The "convenience yield" has completely disappeared : the U.S. Treasury yield has always had an excess return relative to the assumed risk-free rate. Since U.S. Treasury bonds are the most traded and easiest to buy and sell assets in the world, they can be converted into cash instantly when the market panics (such as the financial crisis) or when cash is urgently needed, with almost no discount. This characteristic makes it possible to calculate that there has always been an excess return for holding U.S. Treasury bonds compared with other countries' government bonds. However, this phenomenon has now disappeared and the excess return is even negative, and the convenience yield has completely disappeared.
The so-called "convenience yield," the excess return on U.S. Treasury bonds relative to the assumed risk-free rate, has not only disappeared in recent years but has even turned negative. This convenience yield on U.S. Treasury bonds exists during both economic upturns and downturns, making it irrelevant to long-term economic growth prospects.
Finally, declining U.S. labor data and rising inflation expectations due to tariffs have heightened concerns about stagflation in the U.S. economy. In addition, both Europe and Japan have experienced a sell-off of long-term government bonds, which has impacted the selling of U.S. government bonds and the possibility that the interest rate curve will steepen.
Ultimately, the slope of the yield curve has lost its previous signaling significance. In the current market environment, it has become, to a certain extent, a core barometer of the bond market's confidence in the implementation of monetary policy. Therefore, future signals from the U.S. Treasury yield curve that appear to point to positive economic activity may actually harbor deeper implications.
- Risk Warning and Disclaimer
- The market involves risk, and trading may not be suitable for all investors. This article is for reference only and does not constitute personal investment advice, nor does it take into account certain users’ specific investment objectives, financial situation, or other needs. Any investment decisions made based on this information are at your own risk.