Divergence in the dot plot reveals a major split in the Federal Reserve, with Milan's 2.75% acting as a beacon.
2025-09-19 02:38:39
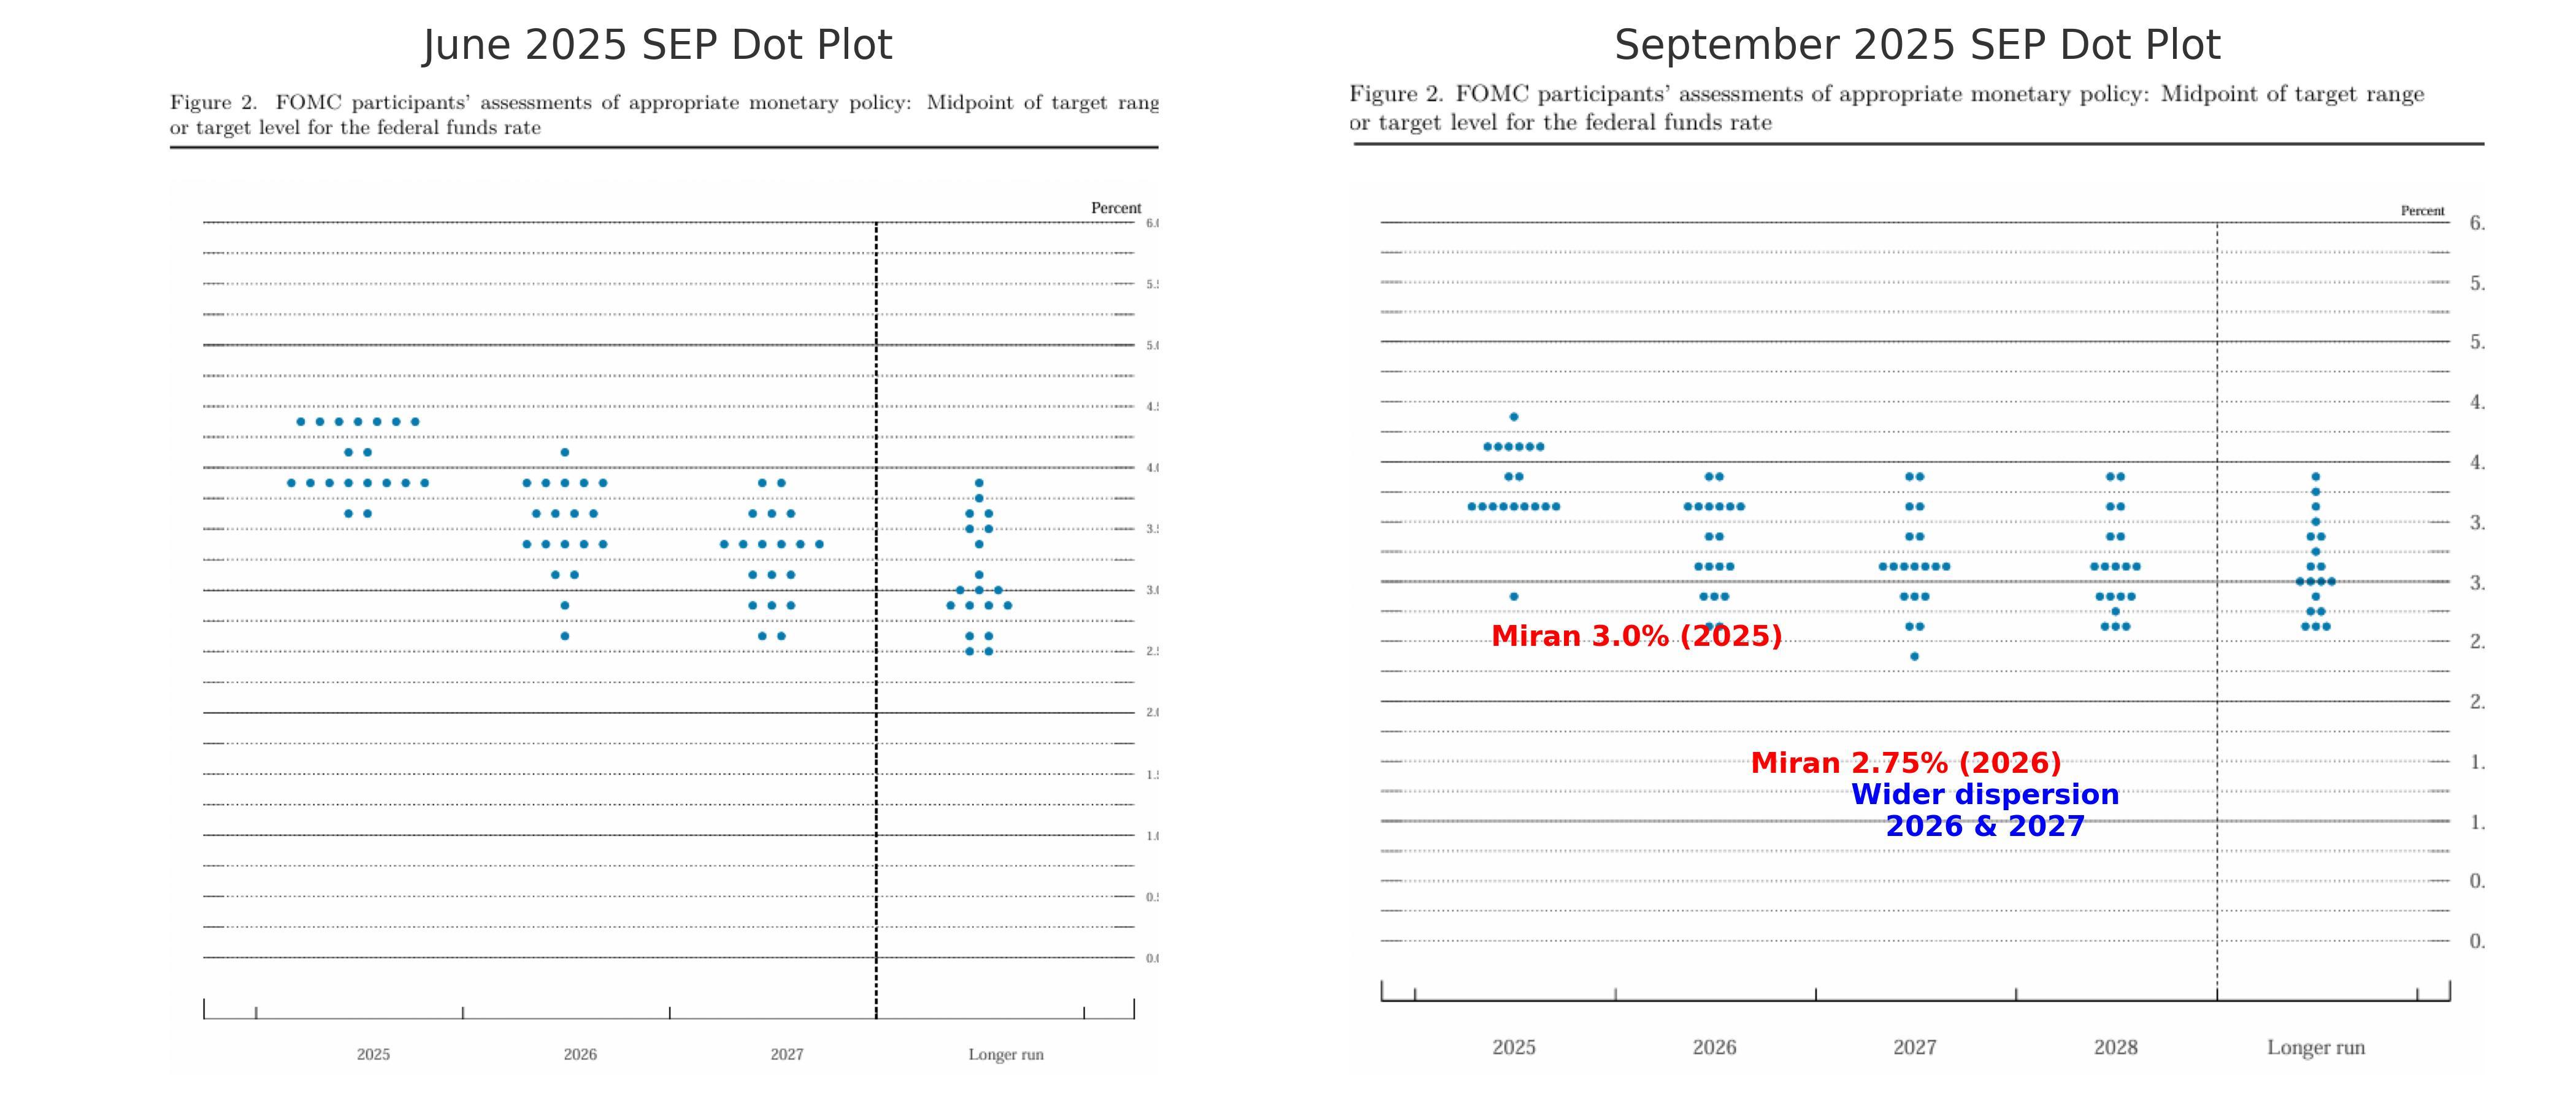
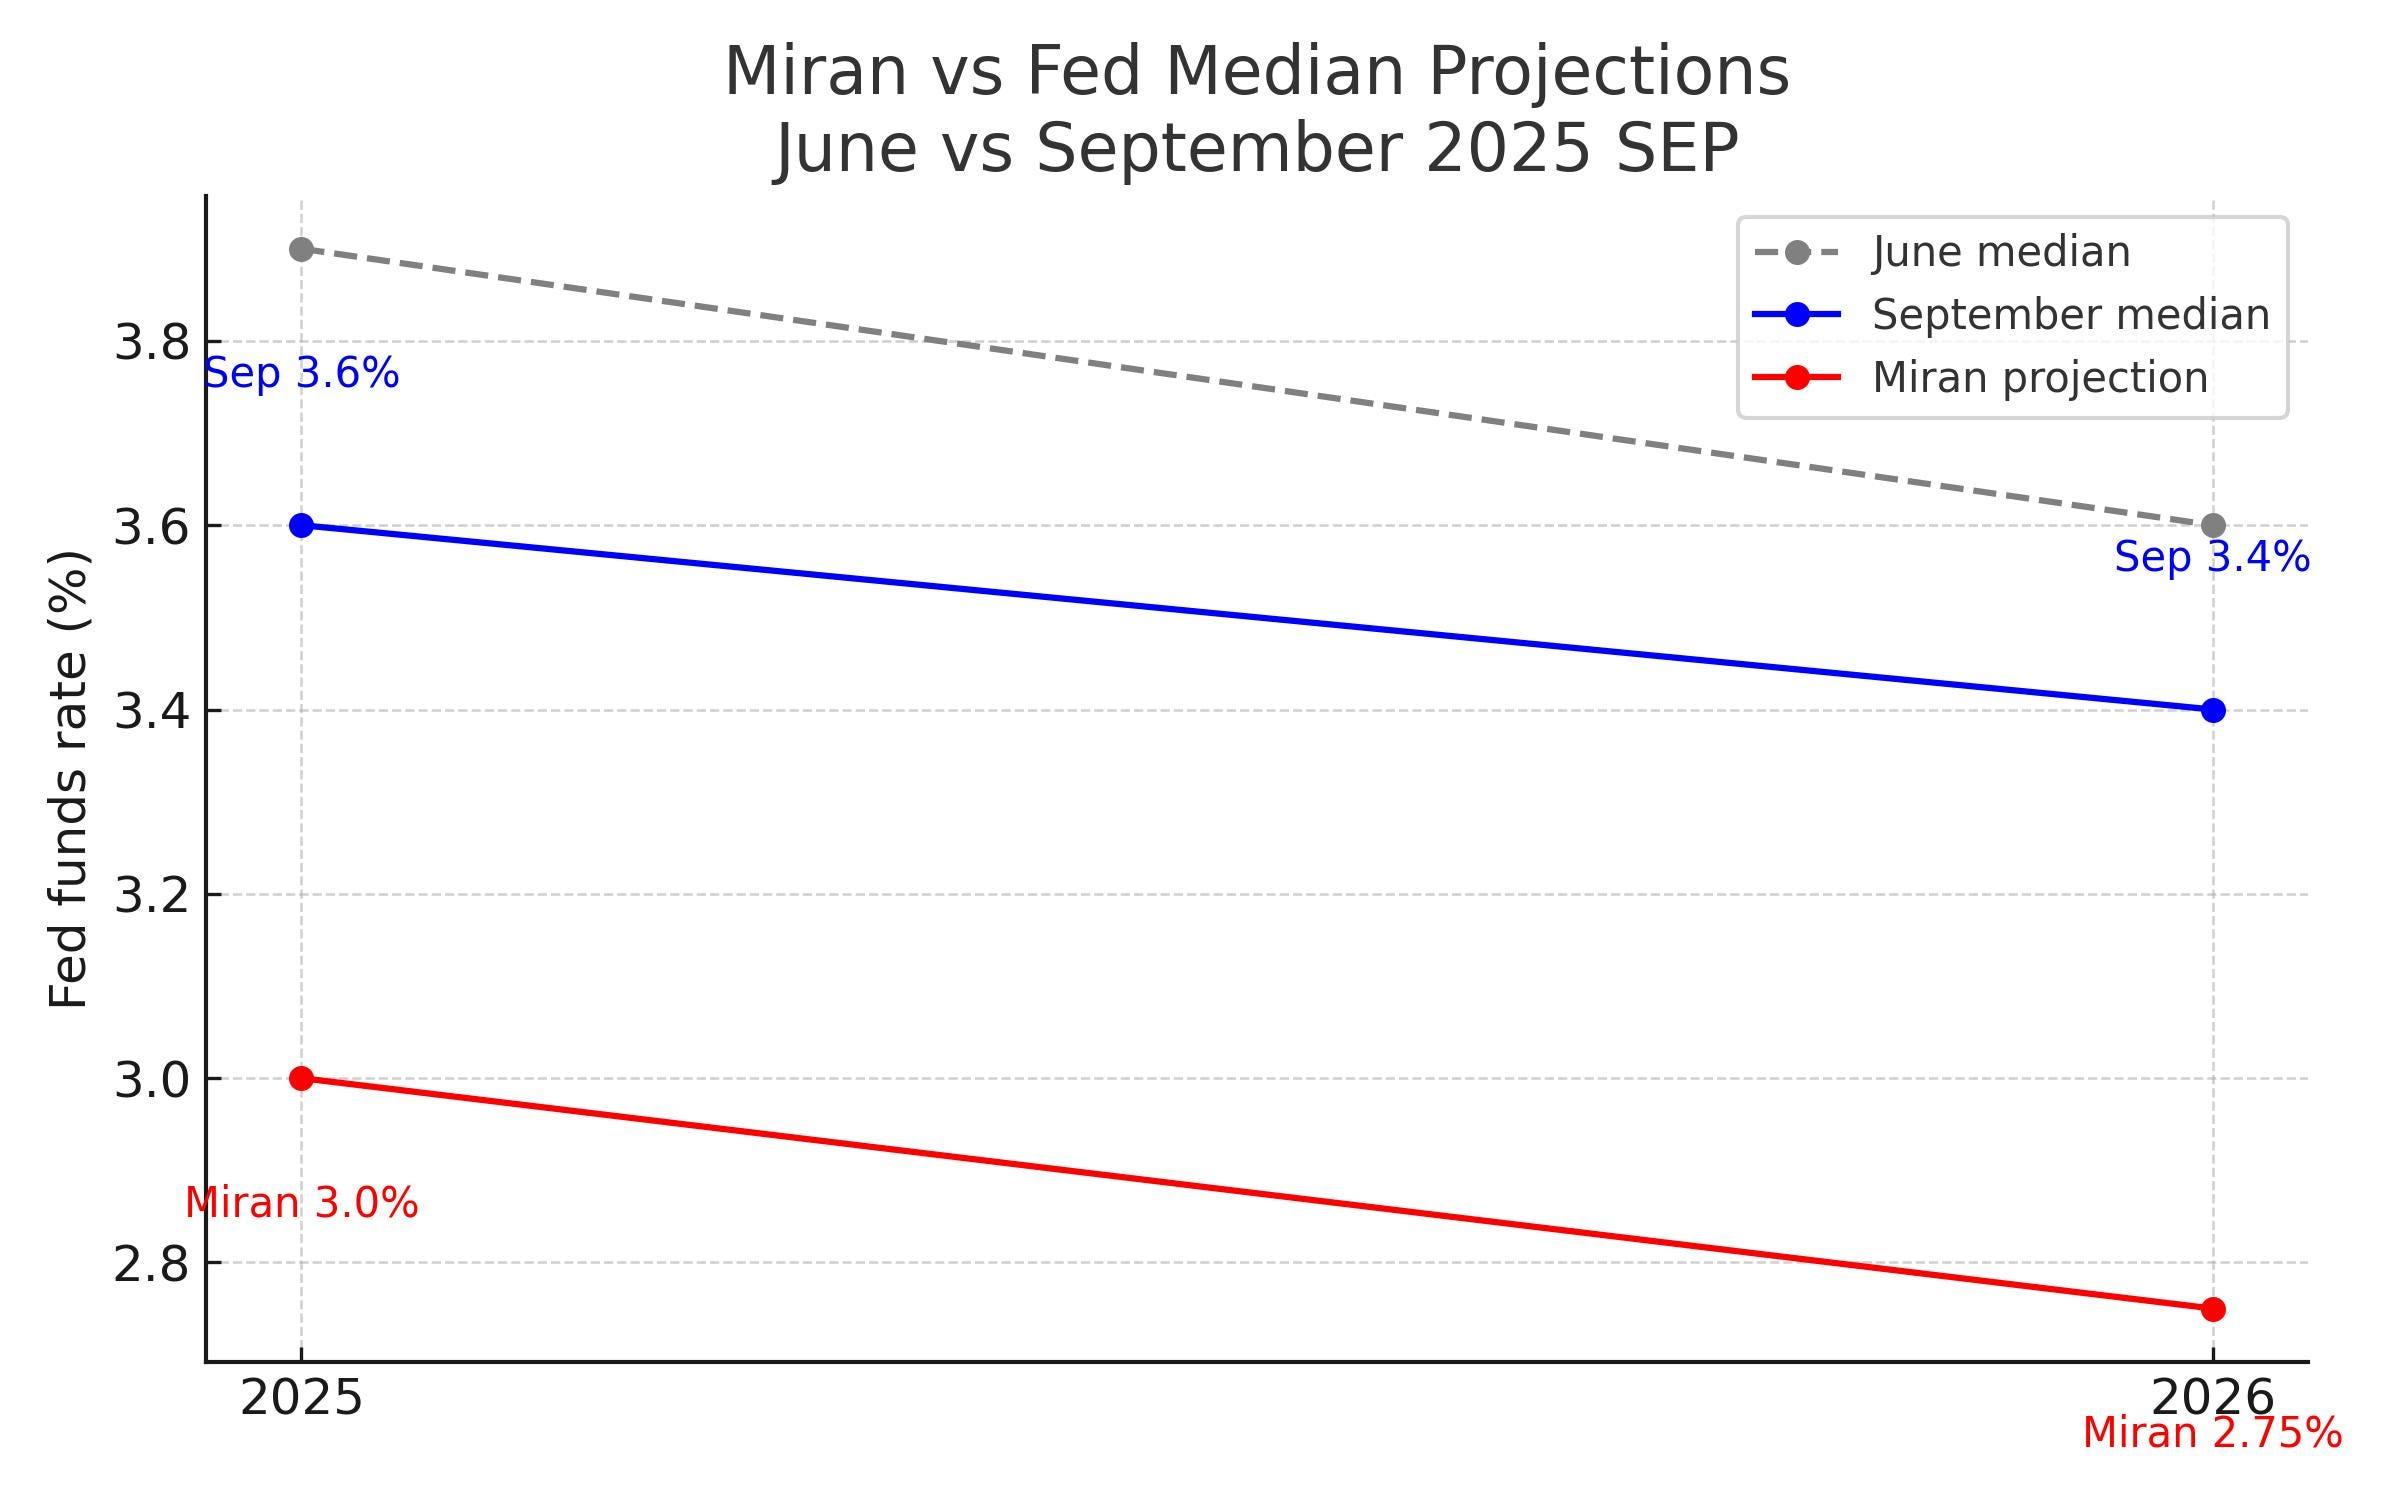
The Federal Reserve's dot plot is not only a barometer of policy signals but also a precise indicator of the market's pulse. The latest dot plot, dated September 17, 2025, reveals unprecedented divisions within the Fed. Interest rate forecasts range from 2.9% to 4.4%, with a median of 3.6%, marking the largest rift in FOMC history. At the heart of this disagreement lies the conflict between the "low-rate camp" led by Stephen Miran and Chris Waller and a lone hawk who advocates for a 4.5% rate hike. This isn't just a numbers game; it's a profound gamble on the economic outlook—tariff shocks, a sluggish labor force, and shifting immigration policies are pushing the United States to an uncharted crossroads. Why is the low forecast more important than the median? Let's peel back the data and uncover the truth.
Dot plot divergence: a signal in the storm
The dot plot mirrors the Federal Reserve's internal divisions over the economic future. Milan predicts interest rates will be as low as 2.75%–3.0% by the end of 2025, with Waller joining his "low-rate camp." Meanwhile, a hawkish member is going all-in, advocating for a rate hike to 4.5%. This range of 2.9% to 4.4% is significantly higher than the 3.5%–3.75% forecast in June, marking a shift in the FOMC debate from the margins to the center.
Bruce Kasman, chief economist at JPMorgan Chase, put it succinctly: "The divergence is like a storm. The low of 2.9% captures the real risk of an economic downturn, while 4.5% is like a castle in the air." Bloomberg further pointed out that Milan's forecast of 2.75% "ignited market expectations for loose policies," especially in the context of tariffs pushing up inflation to 3.5% but potentially lowering GDP to 1.3% in 2025.
Barclays economist Jonathan Millen called the disagreement a "watershed moment for the FOMC," with the low forecast a sober assessment of recession risks and the hawks overly optimistic.
The Financial Times pointedly pointed out that the dot plot reveals a "chasm in the Federal Reserve's understanding of the impact of tariffs and immigration policies," with the low-interest rate camp more concerned about the reality that labor shortages are driving up wages but weakening consumption. Morningstar Chief Multi-Asset Strategist Dominic Pappalardo aptly put it: "Milan's 2.75% is a beacon, illuminating the risks of shrinking consumption and rising debt costs in 2025, while the median 3.6% is just a mirage of compromise."
The low-interest rate camp bases its position on three realities: GDP growth in 2025 will be just 1.6%, the federal deficit will be 6.5% of GDP, and immigration restrictions will exacerbate labor shortages, pushing up wages but suppressing demand. All of these factors point to a single conclusion: a faster rate cut to 2.5%–3.0% is imperative.
The lone hawk: Why 4.5% can't make a difference alone
The hawkish member of the dot plot, who advocates a rate hike to 4.5% by the end of 2025, stands out as a lone figure. He focuses on inflationary pressures caused by tariffs (PCE could break 3.5%) and argues that tightening policy is necessary to prevent overheating. However, this stance has found little support within the FOMC and in the market.
Citigroup Chief Economist Andrew Hollenhorst bluntly stated, "This hawk's 4.5% forecast is like standing on the edge of a cliff, ignoring the devastating depressing effect of tariffs on demand." On social media platform X, investors derided the rate hike forecast as "out of touch with reality," pointing out that a weak labor market (unemployment rate 4.5%) and shrinking consumption (real income growth of only 0.8%) are more likely to drag down growth. The Wall Street Journal analyzed that this hawk's isolation reflects his excessive concern about long-term inflation and lack of sufficient support to shake market expectations. In contrast, the realism of the low-interest rate camp is gaining the upper hand, and the low point of the dot plot has become the true indicator of policy direction.
Milan's low forecast: a beacon for the market
Stephen Milan's 2.75%–3.0% forecast, like a flash of lightning, pierced the fog of the dot plot and became the focus of market attention. He believes that the impact of tariffs and a weak labor force will depress GDP to 1.3% in 2025, and a significant interest rate cut will be needed to stabilize demand.
UBS Chief Economist Paul Donovan stated, "Milan's lows acted as a wake-up call, reminding the market that the Fed had underestimated the risk of a recession." The market reacted swiftly, with the 10-year Treasury yield falling to 3.7% in September, partly due to investors' approval of Milan's prediction. Social media platforms were buzzing about his prediction, claiming it "captured the pulse of the economic downturn," particularly given the potential for immigration restrictions to boost wages but weaken consumption.
Deutsche Bank's chief economist Matthew Luzzetti said it well: "Milan's 2.75% is not just a number, but also a foreshadowing of future policies. The market has already priced it in in advance." Milan's low point is becoming a beacon for investors, indicating that short-term interest rates may fall further before October 2025, igniting expectations for loose policies.
The rise of the low-interest rate camp: a harbinger of an easing shift
The rise of the low-interest rate camp signals a reassessment of the Federal Reserve's economic outlook. Milan and Waller's 2.75%–3.0% forecast serves as a banner, signaling a shift toward easing policy. Their insights are based on three major risks: tariffs are driving up inflation (PCE could reach 3.5%) while suppressing demand; a sluggish labor market (unemployment rate at 4.5% and slowing non-farm payroll growth) is exacerbating consumption contraction; and immigration restrictions are leading to labor shortages, pushing up wages but weakening economic growth.
Bloomberg News analyzed, "The low-rate camp is reshaping market expectations, as evidenced by the drop in Treasury yields to 3.7% in September." Waller recently stated that if tariffs lead to job losses, he supports faster rate cuts, echoing Milan's stance. Morgan Stanley Chief Economist Alan Zener noted, "The rise of the low-rate camp suggests accelerated easing in 2025 to address the dilemma of a 20% increase in debt costs and a mere 0.8% increase in real income." The X platform shows that investors are flocking to the low-rate camp, believing its forecasts are more in line with the economic pulse. By the end of Powell's term in May 2026, the influence of Milan and Waller will be further amplified, and short-term interest rates may fall earlier, signaling a structural shift by the Federal Reserve toward more accommodative policy.
The strategic significance of the dot plot low
The divergence in the dot plot—from a hawkish 4.5% to a dovish 2.75%—ushers in a new chapter in Federal Reserve policy. The rise of the low-interest rate camp reflects a sharp assessment of downside risks to the economy, particularly against the backdrop of complex tariff, labor market, and immigration policies. MacroAnchor firmly believes that interest rates should be lowered to 2.5%–3.0% by the end of 2026 to ease debt burdens, restore disposable incomes, and stabilize demand.
Deutsche Bank Chief Economist Matthew Luzzetti concluded, "The low point in the dot plot has illuminated recession risks for investors, potentially driving market expectations for further easing in 2025." The low point forecast exceeds the median 3.6%, providing a more realistic guidepost for markets and policymakers. October's CPI and employment data will be crucial in determining whether the low-interest-rate camp can dominate the Federal Reserve's future.
- Risk Warning and Disclaimer
- The market involves risk, and trading may not be suitable for all investors. This article is for reference only and does not constitute personal investment advice, nor does it take into account certain users’ specific investment objectives, financial situation, or other needs. Any investment decisions made based on this information are at your own risk.