Where will gold go after approaching 4050? The answer lies in these three "rooms"
2025-10-08 18:15:26
On Wednesday (October 8), spot gold prices continued their strong trend, reaching a new all-time high of $4,049.43 per ounce. This break above $4,000 wasn't an isolated event, but rather a direct result of the US government shutdown entering its seventh day, growing expectations of a Fed rate cut, and geopolitical uncertainty. The 4-hour chart shows that prices have broken out of their recent consolidation range, demonstrating a clear bullish trend. However, the accumulation of overbought signals also warns traders of a potential market correction. The following analysis will combine the latest market data and technical indicators to analyze the current trend layer by layer, incorporating fundamental drivers to provide a clear logical framework for professional traders.

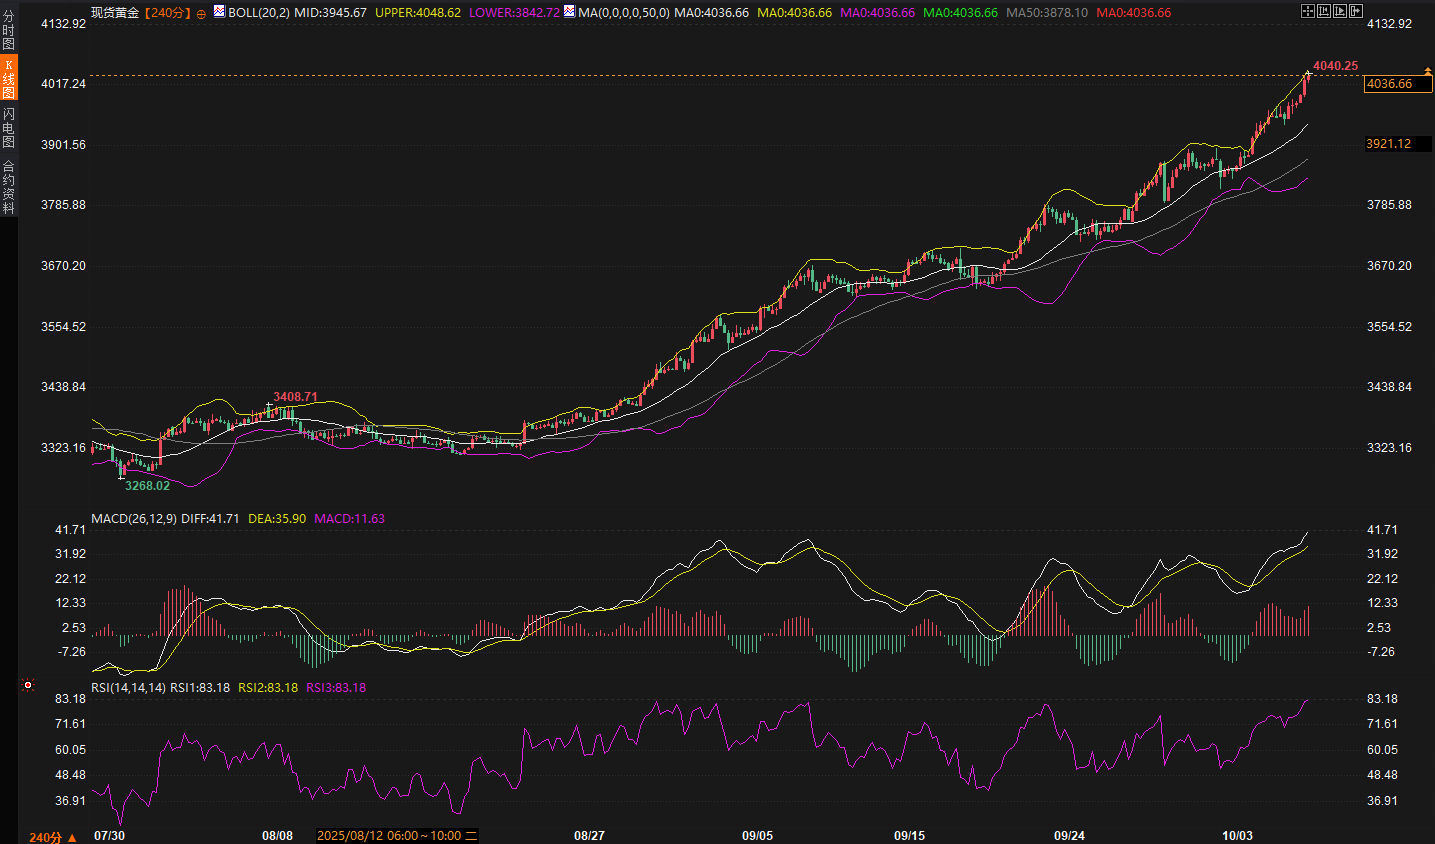
The 4-hour spot gold chart clearly outlines a strong upward trend. Since its recent low, the price has formed a stair-step upward structure. Each upward move has been accompanied by moderately increasing trading volume, indicating an orderly advance of long positions. At the time of this screenshot, the price was trading at $4,036.56 per ounce. The candlestick chart has broken through the upper Bollinger Band at 4,024.99 and briefly touched the all-time high of 4,040.25. This not only confirms a strong trend reversal but also reinforces the market's preference for safe-haven assets. Moving averages also support this view: the 50-period simple moving average (SMA) at 3,866.55 is sloping upward and acting as dynamic support, while shorter-term moving averages, such as the 4,036.66 MA, are following the price upward, forming a bullish formation and mitigating the risk of price isolation at elevated levels.
Turning to technical indicators, the MACD (parameters 26, 12, 9) shows the DIFF line at 36.59, above the DEA line at 33.21. The histogram momentum is at 6.76, showing a red expanse. This suggests that short-term upward momentum remains dominant, and bulls have room to test resistance at higher levels. The Bollinger Bands are widening, with the upper band at 4024.99 acting as a "magnetic pull" for prices. The middle band at 3928.13 provides a potential anchor for a medium-term correction. The lower band at 3831.27, while distant, could serve as deeper support in the event of an extreme correction. However, the RSI reading, at 87.58, is deeply overbought (well above the 70 threshold), which historically signals a correction after overheated sentiment. Traders should be wary of this disconnect between momentum and overbought conditions. While bullish momentum remains strong, the extreme RSI reading suggests the market may enter a brief period of consolidation to absorb profit-taking.
The establishment of support and resistance levels further refines this picture. Immediate support is focused around 4025, close to the upper Bollinger Band at 4024.99. This level is both a psychological barrier and a technical node for the first confrontation between bulls and bears. If the price stabilizes here, it could signal a buildup of bullish momentum. Conversely, a successful close below 4025 could trigger short-term profit-taking, with a pullback targeting the 4000 round number. This level, a key support level after a breakout from consolidation, has a strong magnetic attraction. Deeper support can be found above the middle Bollinger Band at 3928.13. Combined with the recent low, this range could serve as the baseline for a mid-term correction. Upward resistance lies at historical highs and round numbers: 4040 has become a recent test point. If it holds above, 4050 and 4080 could become extension targets for bulls. However, be mindful of the "stumbling block" effect of these round numbers—prices at high levels often face selling pressure.
Market discussions over the past 12 hours have revealed traders' mixed feelings about this market trend. On the one hand, a break above 4,000 is seen as a continuation of the bull market, with many emphasizing that "buying will continue as long as uncertainty persists." This echoes recent data on ETF inflows: North American funds have led net inflows of $26 billion since September, a recent high. This FOMO (fear of missing out) has fueled the accumulation of unrealized profits in leveraged long positions, but it has also amplified the risk of margin calls: one trader commented, "Long-term unrealized profits have exceeded expectations, but the pressure of chasing highs is lingering." On the other hand, overbought signals have raised concerns about a potential correction. While an RSI reading approaching 70 hasn't dampened enthusiasm, it's generally considered a buy, not a sell, signaling market resilience, even as profit-taking has begun to take hold.
This sentiment dynamic isn't abstract; it directly impacts position management: while long positions can yield lucrative returns, they also increase the risk of a liquidity trap. Once external triggers intervene, the probability of a flash crash increases. This is consistent with historical experience—roundings like 4,000 often trigger profit-taking. Traders should remain vigilant against overbought corrections even as they celebrate new highs.
The underlying logic of the current market trend is rooted in the amplification of fundamental uncertainty. The week-long US government shutdown has not only suppressed economic data releases but also heightened market sensitivity to Fed policy. Expectations of interest rate cuts have become one of the "twin engines," with the probability of a 25 basis point cut at the October 29th meeting rising to 95%. This offers gold the dual benefits of both inflation hedging and reduced opportunity costs. Reputable analysts point out that if the jobs data released after the shutdown is weak, it will further reinforce bullish expectations; however, if the data is unexpectedly strong, it could push up the US dollar and US Treasury yields, creating a backlash effect. Traders should be aware of this blind spot: the market often over-invests in the "bad data = gold price rise" equation while underestimating the impact of "good data" on risk aversion.
The spillover effects are also worth exploring. Gold's rise has pushed the US dollar index down to around 98.88, forming a classic negative correlation. However, reverse transmission cannot be ignored: During the shutdown, demand for US Treasuries surged, pushing yields back to 4.2%, minimizing the risk of capital outflows from gold. Once reopened, easing fiscal concerns could spur active US Treasury auctions, and a rebound in yields could attract capital inflows, suppressing the XAU/USD pair. Reputable institutions have observed that this dynamic is not a one-way street. The simultaneous rise in stock markets like the S&P 500 and Nasdaq suggests that risk appetite remains, and gold is playing a hybrid role as both a safe haven and an inflation hedge. For traders, this means monitoring the DXY for a break above 99.50 (near its recent high), which could trigger capital outflows and amplify a correction in gold towards the 4000 support level.
Geopolitical factors offer a short-term "flashpoint." The progress of Middle East ceasefire negotiations is attracting significant attention. If successfully concluded, it could shave 2-3% off the safe-haven premium, leading to a short-term price drop. Conversely, eastern developments in the Russia-Ukraine situation or escalating tensions between Israel and Iran could instantly ignite bullish sentiment, pushing prices to around 4050. Political fragmentation in Europe, such as the French budget crisis and leadership changes in Japan, is also considered an undervalued variable: these events could weaken the euro, indirectly strengthening the dollar's relative strength and weighing on gold. This blind spot is evident in trader discussions: dominated by macro narratives, geopolitical emergencies are often marginalized, yet they can create opportunities for "rekindling" at elevated levels.
Global central banks' gold purchases have been a stabilizing force. The People's Bank of China increased its holdings by 1.24 tons in September, marking 11 consecutive months of net purchases and bringing total weekly demand to $35.5 billion. This has supported structural demand, and leading institutions have raised their target for the end of 2026 to $4,900, citing central bank hoarding and private diversification as reasons. However, signs of a slowdown are already emerging: a 30% drop from the 2024 peak. If global growth rebounds (e.g., if stimulus policies are effective), buying may slow. This makes the market "look tough"—ETFs and central banks account for 70% of holdings, and the influx of large funds enhances resilience, but also amplifies the liquidity risks of profit-taking. Traders point out that "this is not simply retail chasing the rally, but a reflection of structural risk aversion."
Well-known institutions, including another major bank, have warned of "upward fatigue." Historical data shows that similar round-number breakouts since 1979 have triggered 15% pullbacks. This points to a collective blind spot among analysts: their obsession with rate cuts and central bank "macro narratives," while overlooking a core pain point for traders: "false breakouts" following overbought conditions. Tonight's FOMC meeting minutes will be crucial. If they signal a dovish tone, bulls could head straight for 4050; a hawkish tilt increases the probability of a pullback to 3950. Retail traders are more pragmatic, emphasizing "focusing on consolidation rather than sharp gains," which aligns with the technical logic of overbought conditions.
Looking ahead, spot gold's strong performance is expected to persist in the short term, but the rhythm of the high-level market will determine subsequent developments. If bulls can effectively consolidate above 4025, accompanied by a steady expansion of the MACD momentum bar, prices are expected to challenge resistance at 4050 or even 4080, continuing their step-by-step upward trend to new highs for the year. Conversely, if the RSI's overbought condition is triggered by a break below 4025, a pullback to the 4000-3950 support zone will become inevitable. The middle Bollinger Band at 3928.13 will test the stability of the medium-term bullish trend. External factors such as the pace of government reopening, the tone of the Fed minutes, and geopolitical developments will determine the depth and duration of the correction: if dovish signals dominate, the pullback may be brief; if hawkish signals or spillover effects intensify, the correction could extend to near the medium-term low. The structural support of the central bank's gold purchases ensures that downside risks are limited, but the test of the market's "hardness" lies in whether the liquidity trap can be resolved. Especially against the backdrop of low-level fluctuations in the US dollar index, this round of high-level fluctuations will provide a window for trend confirmation.
Technical analysis: Bullish momentum is strong, but overbought pressure is gradually emerging
The 4-hour spot gold chart clearly outlines a strong upward trend. Since its recent low, the price has formed a stair-step upward structure. Each upward move has been accompanied by moderately increasing trading volume, indicating an orderly advance of long positions. At the time of this screenshot, the price was trading at $4,036.56 per ounce. The candlestick chart has broken through the upper Bollinger Band at 4,024.99 and briefly touched the all-time high of 4,040.25. This not only confirms a strong trend reversal but also reinforces the market's preference for safe-haven assets. Moving averages also support this view: the 50-period simple moving average (SMA) at 3,866.55 is sloping upward and acting as dynamic support, while shorter-term moving averages, such as the 4,036.66 MA, are following the price upward, forming a bullish formation and mitigating the risk of price isolation at elevated levels.
Turning to technical indicators, the MACD (parameters 26, 12, 9) shows the DIFF line at 36.59, above the DEA line at 33.21. The histogram momentum is at 6.76, showing a red expanse. This suggests that short-term upward momentum remains dominant, and bulls have room to test resistance at higher levels. The Bollinger Bands are widening, with the upper band at 4024.99 acting as a "magnetic pull" for prices. The middle band at 3928.13 provides a potential anchor for a medium-term correction. The lower band at 3831.27, while distant, could serve as deeper support in the event of an extreme correction. However, the RSI reading, at 87.58, is deeply overbought (well above the 70 threshold), which historically signals a correction after overheated sentiment. Traders should be wary of this disconnect between momentum and overbought conditions. While bullish momentum remains strong, the extreme RSI reading suggests the market may enter a brief period of consolidation to absorb profit-taking.
The establishment of support and resistance levels further refines this picture. Immediate support is focused around 4025, close to the upper Bollinger Band at 4024.99. This level is both a psychological barrier and a technical node for the first confrontation between bulls and bears. If the price stabilizes here, it could signal a buildup of bullish momentum. Conversely, a successful close below 4025 could trigger short-term profit-taking, with a pullback targeting the 4000 round number. This level, a key support level after a breakout from consolidation, has a strong magnetic attraction. Deeper support can be found above the middle Bollinger Band at 3928.13. Combined with the recent low, this range could serve as the baseline for a mid-term correction. Upward resistance lies at historical highs and round numbers: 4040 has become a recent test point. If it holds above, 4050 and 4080 could become extension targets for bulls. However, be mindful of the "stumbling block" effect of these round numbers—prices at high levels often face selling pressure.
Market sentiment: hidden concerns amidst the bull market
Market discussions over the past 12 hours have revealed traders' mixed feelings about this market trend. On the one hand, a break above 4,000 is seen as a continuation of the bull market, with many emphasizing that "buying will continue as long as uncertainty persists." This echoes recent data on ETF inflows: North American funds have led net inflows of $26 billion since September, a recent high. This FOMO (fear of missing out) has fueled the accumulation of unrealized profits in leveraged long positions, but it has also amplified the risk of margin calls: one trader commented, "Long-term unrealized profits have exceeded expectations, but the pressure of chasing highs is lingering." On the other hand, overbought signals have raised concerns about a potential correction. While an RSI reading approaching 70 hasn't dampened enthusiasm, it's generally considered a buy, not a sell, signaling market resilience, even as profit-taking has begun to take hold.
This sentiment dynamic isn't abstract; it directly impacts position management: while long positions can yield lucrative returns, they also increase the risk of a liquidity trap. Once external triggers intervene, the probability of a flash crash increases. This is consistent with historical experience—roundings like 4,000 often trigger profit-taking. Traders should remain vigilant against overbought corrections even as they celebrate new highs.
Fundamental drivers: dual support from shutdown and interest rate cuts
The underlying logic of the current market trend is rooted in the amplification of fundamental uncertainty. The week-long US government shutdown has not only suppressed economic data releases but also heightened market sensitivity to Fed policy. Expectations of interest rate cuts have become one of the "twin engines," with the probability of a 25 basis point cut at the October 29th meeting rising to 95%. This offers gold the dual benefits of both inflation hedging and reduced opportunity costs. Reputable analysts point out that if the jobs data released after the shutdown is weak, it will further reinforce bullish expectations; however, if the data is unexpectedly strong, it could push up the US dollar and US Treasury yields, creating a backlash effect. Traders should be aware of this blind spot: the market often over-invests in the "bad data = gold price rise" equation while underestimating the impact of "good data" on risk aversion.
The spillover effects are also worth exploring. Gold's rise has pushed the US dollar index down to around 98.88, forming a classic negative correlation. However, reverse transmission cannot be ignored: During the shutdown, demand for US Treasuries surged, pushing yields back to 4.2%, minimizing the risk of capital outflows from gold. Once reopened, easing fiscal concerns could spur active US Treasury auctions, and a rebound in yields could attract capital inflows, suppressing the XAU/USD pair. Reputable institutions have observed that this dynamic is not a one-way street. The simultaneous rise in stock markets like the S&P 500 and Nasdaq suggests that risk appetite remains, and gold is playing a hybrid role as both a safe haven and an inflation hedge. For traders, this means monitoring the DXY for a break above 99.50 (near its recent high), which could trigger capital outflows and amplify a correction in gold towards the 4000 support level.
Geopolitical factors offer a short-term "flashpoint." The progress of Middle East ceasefire negotiations is attracting significant attention. If successfully concluded, it could shave 2-3% off the safe-haven premium, leading to a short-term price drop. Conversely, eastern developments in the Russia-Ukraine situation or escalating tensions between Israel and Iran could instantly ignite bullish sentiment, pushing prices to around 4050. Political fragmentation in Europe, such as the French budget crisis and leadership changes in Japan, is also considered an undervalued variable: these events could weaken the euro, indirectly strengthening the dollar's relative strength and weighing on gold. This blind spot is evident in trader discussions: dominated by macro narratives, geopolitical emergencies are often marginalized, yet they can create opportunities for "rekindling" at elevated levels.
Global central banks' gold purchases have been a stabilizing force. The People's Bank of China increased its holdings by 1.24 tons in September, marking 11 consecutive months of net purchases and bringing total weekly demand to $35.5 billion. This has supported structural demand, and leading institutions have raised their target for the end of 2026 to $4,900, citing central bank hoarding and private diversification as reasons. However, signs of a slowdown are already emerging: a 30% drop from the 2024 peak. If global growth rebounds (e.g., if stimulus policies are effective), buying may slow. This makes the market "look tough"—ETFs and central banks account for 70% of holdings, and the influx of large funds enhances resilience, but also amplifies the liquidity risks of profit-taking. Traders point out that "this is not simply retail chasing the rally, but a reflection of structural risk aversion."
Blind focus on the disconnect between macro narratives and transaction pain points
Well-known institutions, including another major bank, have warned of "upward fatigue." Historical data shows that similar round-number breakouts since 1979 have triggered 15% pullbacks. This points to a collective blind spot among analysts: their obsession with rate cuts and central bank "macro narratives," while overlooking a core pain point for traders: "false breakouts" following overbought conditions. Tonight's FOMC meeting minutes will be crucial. If they signal a dovish tone, bulls could head straight for 4050; a hawkish tilt increases the probability of a pullback to 3950. Retail traders are more pragmatic, emphasizing "focusing on consolidation rather than sharp gains," which aligns with the technical logic of overbought conditions.
Future Trend Outlook
Looking ahead, spot gold's strong performance is expected to persist in the short term, but the rhythm of the high-level market will determine subsequent developments. If bulls can effectively consolidate above 4025, accompanied by a steady expansion of the MACD momentum bar, prices are expected to challenge resistance at 4050 or even 4080, continuing their step-by-step upward trend to new highs for the year. Conversely, if the RSI's overbought condition is triggered by a break below 4025, a pullback to the 4000-3950 support zone will become inevitable. The middle Bollinger Band at 3928.13 will test the stability of the medium-term bullish trend. External factors such as the pace of government reopening, the tone of the Fed minutes, and geopolitical developments will determine the depth and duration of the correction: if dovish signals dominate, the pullback may be brief; if hawkish signals or spillover effects intensify, the correction could extend to near the medium-term low. The structural support of the central bank's gold purchases ensures that downside risks are limited, but the test of the market's "hardness" lies in whether the liquidity trap can be resolved. Especially against the backdrop of low-level fluctuations in the US dollar index, this round of high-level fluctuations will provide a window for trend confirmation.
- Risk Warning and Disclaimer
- The market involves risk, and trading may not be suitable for all investors. This article is for reference only and does not constitute personal investment advice, nor does it take into account certain users’ specific investment objectives, financial situation, or other needs. Any investment decisions made based on this information are at your own risk.