The US dollar rose for four consecutive days and approached the 100 mark. Gold rushed to 4,000 US dollars. Why did negatively correlated assets soar at the same time?
2025-10-09 15:27:26
The US dollar index continued its upward trend during the Asia-Europe session on Thursday (October 9th), currently rising 0.16% to trade around 98.99. The US dollar index rebounded sharply from 96.21, marking its fourth consecutive day of gains, despite the lack of much positive US data releases.
In recent months, several major countries in the world seem to have entered a mode of competing for misery. The political and economic instability in Japan and Europe has prompted investors to turn to the US dollar. The Reserve Bank of New Zealand has also cut interest rates by 50 basis points, which is more than expected. In other words, the weakness of other currencies has prompted the rise of the US dollar.
This heightened global uncertainty has also pushed gold past the $4,000 per ounce mark. Interestingly, this has led to a simultaneous rise in both the dollar and gold, with both retail and institutional demand rising amidst central banks' asset diversification and geopolitical tensions.
At the same time, conflicting signals from dovish and hawkish members of the Federal Open Market Committee (FOMC) have made the direction of US policy unclear, thereby stimulating demand for safe-haven assets.
Although for different reasons, both the US dollar and gold are benefiting from the current global unease. The US dollar index (DXY) has climbed to nearly 99.00, supported more by the fragility of the global situation than by domestic optimism in the United States.
Japan's political transition has reignited market expectations for loose policies, Europe is mired in industrial difficulties and political pressure, and New Zealand unexpectedly cut interest rates by 50 basis points due to its weak domestic economy. Against this backdrop, investors still regard the US dollar as the "relative best choice" among major currencies.
Although the prolonged US government shutdown has led to reduced data transparency, data from the Bank for International Settlements (BIS) shows that the US dollar is involved in almost 90% of all foreign exchange transactions. This data confirms the US dollar's dominance and thus enhances its safe-haven appeal.
Meanwhile, gold broke through $4,000 per ounce, breaking its typically negative correlation with the US dollar. This simultaneous rise highlights how overlapping geopolitical, fiscal, and monetary risks are driving both asset classes higher. Investors are not only hedging against short-term volatility but also grappling with deeper structural uncertainties.
The latest Federal Open Market Committee meeting minutes revealed internal divisions: Stephen Miran, a member of the Federal Reserve Board, advocated for a quick rate cut to protect employment, while Jeff Schmid of the Kansas City Federal Reserve Bank warned against underestimating the persistence of inflation. This policy ambiguity has undermined market confidence in the policy direction, further driving up demand for alternative stores of value.
Monetary and structural factors continue to drive gold's gains. Central banks are on track to purchase more than 1,000 tons of gold for the fourth consecutive year, with official gold holdings exceeding US Treasuries for the first time since the mid-1990s—a symbolic shift in foreign exchange reserve strategy. Record inflows into exchange-traded funds (ETFs) and continued buying by retail investors are broadening the foundation for gold's gains.
At the same time, ongoing geopolitical tensions, from Russia's rhetoric of "hybrid warfare" to heightened friction between the US and Europe, have made gold a universal safe-haven asset. These factors have combined to create a seemingly paradoxical situation: the dollar has strengthened due to its relative stability, while gold has risen due to declining market confidence. While the two gains stem from different factors, they have formed a mutually reinforcing trend.
Whether these two types of assets can continue to strengthen depends on the progress of US fiscal negotiations, turning points in domestic politics and data in the eurozone and Japan, the extent of the Federal Reserve's interest rate cuts, and global growth risks.
If U.S. data continues to be delayed due to the government shutdown, markets will continue to trade based on relative logic - buying dollars for liquidity and buying gold for protection.
Both the US dollar and gold should continue to be key indicators of confidence in global governance and monetary stability.
On the 4-hour chart, the US Dollar Index has continued its upward momentum since breaking through the resistance level of the descending trendline. The index has recently tested near 99.00, the upper limit of the ascending channel, where it encountered minor resistance and subsequently experienced a pullback. Despite this, it quickly recovered after touching the middle limit today. Both the MACD and RSI indicators suggest continued upward movement. Resistance is at the upper limit of the ascending channel, while support is at the middle limit.
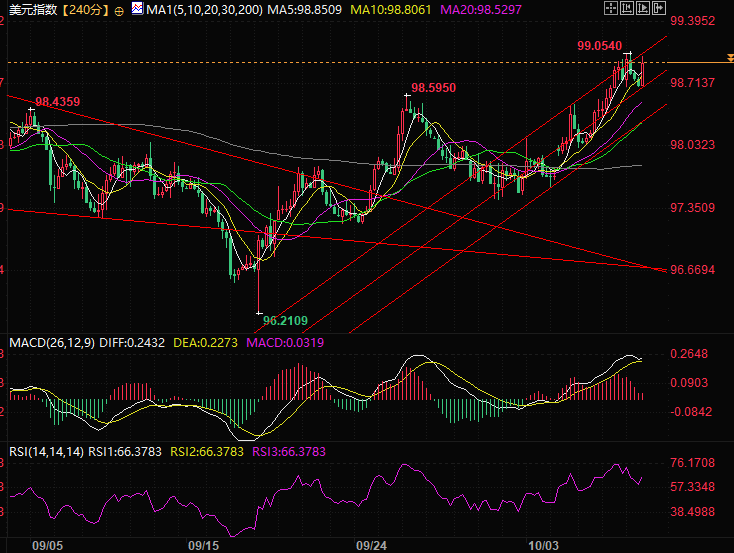
(Dollar Index 4-hour chart)
The US dollar index has just barely broken through the downtrend line and the neckline of the previous head-and-shoulders pattern. While this move is somewhat forced, if the index can maintain a stable position above these two lines, it will indicate that the bearish pressure from the previous head-and-shoulders pattern and the descending resistance line has been resolved, and the index is likely to continue its rebound. Current resistance lies near 100, the bull-bear dividing line for the US dollar index, and near 99.43, which represents the 50% percentile of the large negative candlestick pattern seen in the non-farm payroll report released on August 1st of this year.
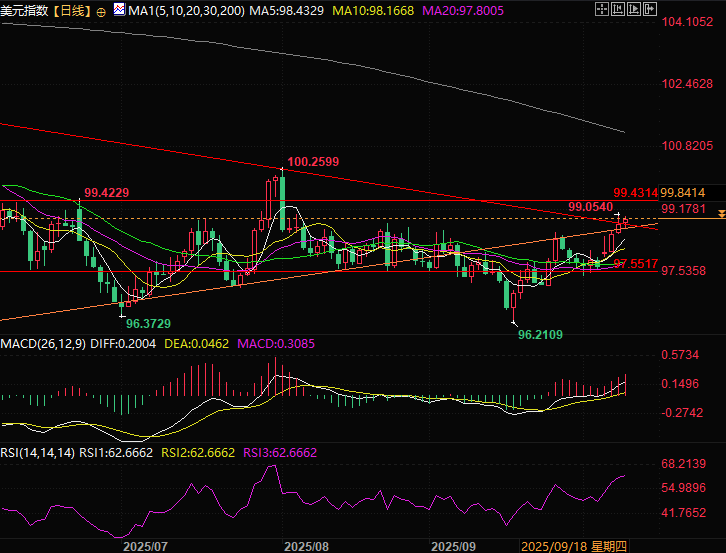
(Daily chart of the US dollar index, source: Yihuitong)
At 15:26 Beijing time, the US dollar index is currently at 98.99.
In recent months, several major countries in the world seem to have entered a mode of competing for misery. The political and economic instability in Japan and Europe has prompted investors to turn to the US dollar. The Reserve Bank of New Zealand has also cut interest rates by 50 basis points, which is more than expected. In other words, the weakness of other currencies has prompted the rise of the US dollar.
This heightened global uncertainty has also pushed gold past the $4,000 per ounce mark. Interestingly, this has led to a simultaneous rise in both the dollar and gold, with both retail and institutional demand rising amidst central banks' asset diversification and geopolitical tensions.
At the same time, conflicting signals from dovish and hawkish members of the Federal Open Market Committee (FOMC) have made the direction of US policy unclear, thereby stimulating demand for safe-haven assets.
The dollar rose mainly due to the decline of yen and euro
Although for different reasons, both the US dollar and gold are benefiting from the current global unease. The US dollar index (DXY) has climbed to nearly 99.00, supported more by the fragility of the global situation than by domestic optimism in the United States.
Japan's political transition has reignited market expectations for loose policies, Europe is mired in industrial difficulties and political pressure, and New Zealand unexpectedly cut interest rates by 50 basis points due to its weak domestic economy. Against this backdrop, investors still regard the US dollar as the "relative best choice" among major currencies.
Although the prolonged US government shutdown has led to reduced data transparency, data from the Bank for International Settlements (BIS) shows that the US dollar is involved in almost 90% of all foreign exchange transactions. This data confirms the US dollar's dominance and thus enhances its safe-haven appeal.
Gold remains strong as global unease intensifies
Meanwhile, gold broke through $4,000 per ounce, breaking its typically negative correlation with the US dollar. This simultaneous rise highlights how overlapping geopolitical, fiscal, and monetary risks are driving both asset classes higher. Investors are not only hedging against short-term volatility but also grappling with deeper structural uncertainties.
The latest Federal Open Market Committee meeting minutes revealed internal divisions: Stephen Miran, a member of the Federal Reserve Board, advocated for a quick rate cut to protect employment, while Jeff Schmid of the Kansas City Federal Reserve Bank warned against underestimating the persistence of inflation. This policy ambiguity has undermined market confidence in the policy direction, further driving up demand for alternative stores of value.
Monetary and structural factors continue to drive gold's gains. Central banks are on track to purchase more than 1,000 tons of gold for the fourth consecutive year, with official gold holdings exceeding US Treasuries for the first time since the mid-1990s—a symbolic shift in foreign exchange reserve strategy. Record inflows into exchange-traded funds (ETFs) and continued buying by retail investors are broadening the foundation for gold's gains.
At the same time, ongoing geopolitical tensions, from Russia's rhetoric of "hybrid warfare" to heightened friction between the US and Europe, have made gold a universal safe-haven asset. These factors have combined to create a seemingly paradoxical situation: the dollar has strengthened due to its relative stability, while gold has risen due to declining market confidence. While the two gains stem from different factors, they have formed a mutually reinforcing trend.
Future Outlook:
Whether these two types of assets can continue to strengthen depends on the progress of US fiscal negotiations, turning points in domestic politics and data in the eurozone and Japan, the extent of the Federal Reserve's interest rate cuts, and global growth risks.
If U.S. data continues to be delayed due to the government shutdown, markets will continue to trade based on relative logic - buying dollars for liquidity and buying gold for protection.
Both the US dollar and gold should continue to be key indicators of confidence in global governance and monetary stability.
Technical Analysis:
On the 4-hour chart, the US Dollar Index has continued its upward momentum since breaking through the resistance level of the descending trendline. The index has recently tested near 99.00, the upper limit of the ascending channel, where it encountered minor resistance and subsequently experienced a pullback. Despite this, it quickly recovered after touching the middle limit today. Both the MACD and RSI indicators suggest continued upward movement. Resistance is at the upper limit of the ascending channel, while support is at the middle limit.
(Dollar Index 4-hour chart)
The US dollar index has just barely broken through the downtrend line and the neckline of the previous head-and-shoulders pattern. While this move is somewhat forced, if the index can maintain a stable position above these two lines, it will indicate that the bearish pressure from the previous head-and-shoulders pattern and the descending resistance line has been resolved, and the index is likely to continue its rebound. Current resistance lies near 100, the bull-bear dividing line for the US dollar index, and near 99.43, which represents the 50% percentile of the large negative candlestick pattern seen in the non-farm payroll report released on August 1st of this year.
(Daily chart of the US dollar index, source: Yihuitong)
At 15:26 Beijing time, the US dollar index is currently at 98.99.
- Risk Warning and Disclaimer
- The market involves risk, and trading may not be suitable for all investors. This article is for reference only and does not constitute personal investment advice, nor does it take into account certain users’ specific investment objectives, financial situation, or other needs. Any investment decisions made based on this information are at your own risk.