Gold at $4,200 Tests the Limits Between High Pressure and Moat
2025-10-21 20:37:39
On Tuesday (October 21st), spot gold was trading above $4,200 before the US market opened, some distance from its high of $4,381.29. Over the past few weeks, safe-haven demand and expectations of a dovish Federal Reserve this year have offset the pressure on gold prices from a temporary rebound in the US dollar and resilience in the equity market. Meanwhile, geopolitical tensions continue to escalate, and the next key macroeconomic trigger will be this week's US inflation data, which will directly impact interest rate and real yield pricing, and thus the marginal direction of gold prices.
Recent fiscal and political uncertainty in the United States continues to linger, with the recurring risk of a government shutdown and the slow pace of fiscal negotiations disrupting economic data releases and expectations management. On the monetary policy front, market expectations for further Fed rate cuts persist, forming a "moderately dovish" psychological anchor alongside forward guidance. This limits the upward potential of real interest rates, favoring gold, a non-yielding asset. Meanwhile, geopolitical tensions remain, strengthening the value of safe-haven assets. Furthermore, any unexpected surprises in the upcoming US inflation report could trigger a repricing of the interest rate path, potentially significantly increasing short-term volatility.
At the dollar level, the temporary strength mainly comes from the resilience of the equity market and the stickiness of short-term yields, but this "strength" is more reflected in short-term suppression rather than a trend reversal: if inflation and growth weaken marginally, or the market re-strengthens the pricing of two interest rate cuts, the dollar's room for decline will be opened, and gold will gain additional momentum.
On the daily chart, core indicators provide a clear signal group of "slowing growth":
Bollinger Bands (BOLL 26,2): Middle Band 3936.91, Upper Band 4371.70, Lower Band 3502.12. The current price is trading within the upper-middle band, having repeatedly approached the upper band at 4371.70, indicating that the trend remains strong. However, the band has widened and entered a "high-level wandering" phase. Short-term trends are highly susceptible to a cycle of pullbacks, retests, and re-attacks near the upper band. Two key horizontal lines are also present on the chart: 4290 and 4200. The former corresponds to the "resistance-support conversion zone" that has recently seen heavy trading volume and the demarcation between bulls and bears, while the latter is a more stable static support level, serving as a "first buffer zone" for pullbacks.
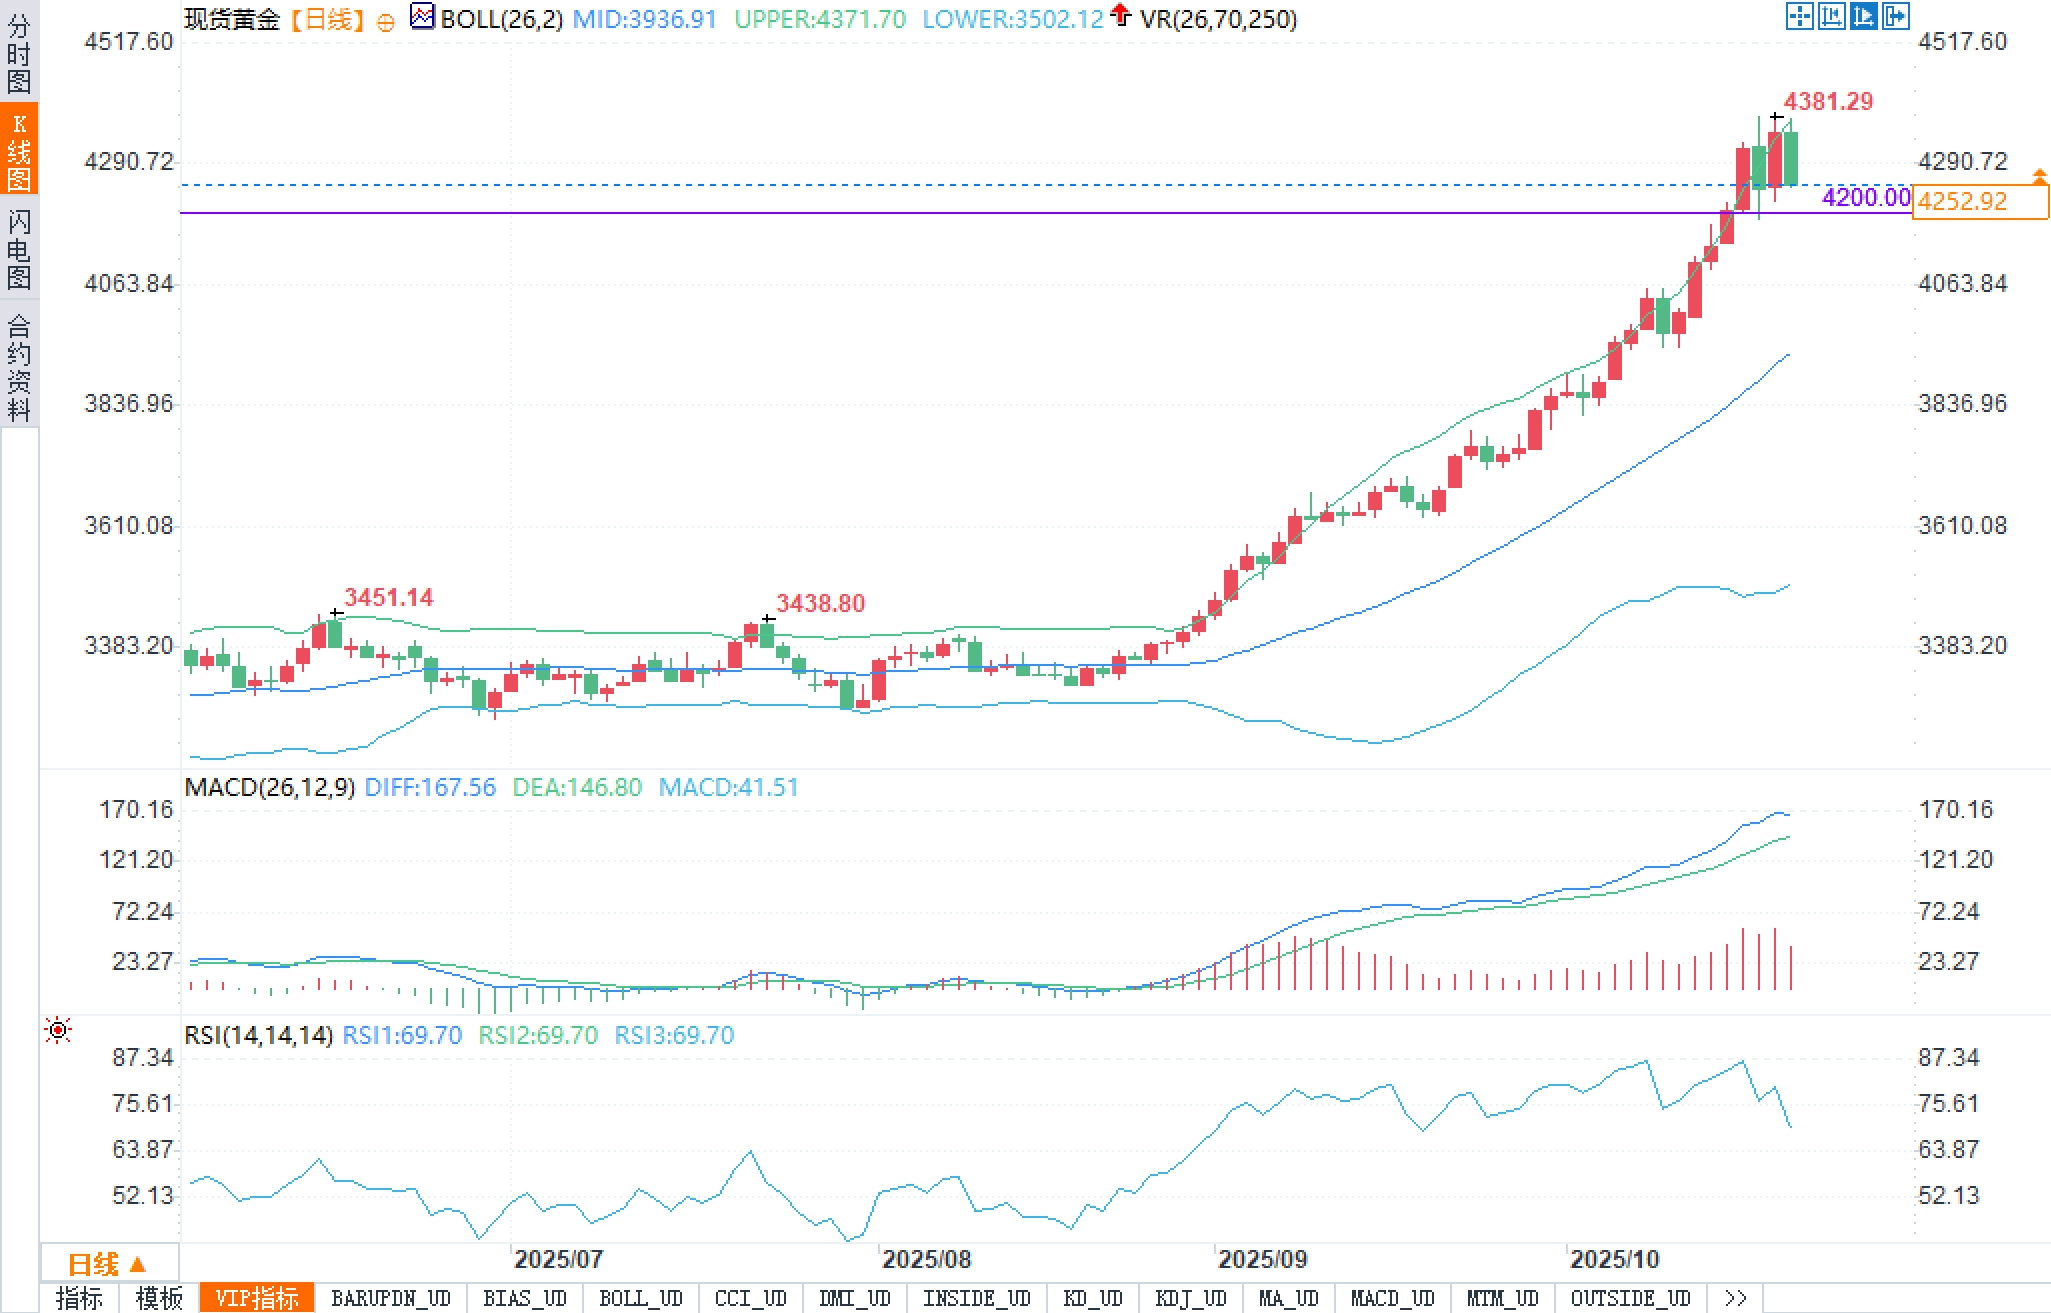
MACD (26,12,9): DIFF 167.56, DEA 146.80, histogram 41.51. The DIFF and DEA remain positively expanding, indicating the mid-term uptrend remains intact. However, the slowdown in growth at the high end of the bar suggests a marginal weakening of momentum. If the DIFF and DEA subsequently converge toward the zero axis, a technical retracement could be triggered to release sluggish momentum. A prime indicator for this is the quality of the backtest between 4290 and 4200.
RSI (14): Located at 69.70, it has fallen back to the lower edge of the strong range. This is a typical picture of "cooling down from a high position without breaking the strong position": RSI retreats from the previous overbought zone to around 69.70, which is more indicative of a rhythm change rather than a trend reversal. If RSI turns upward again in the 65-70 area, it is often seen in the second force scenario of a strong trend.
K-line chart structure: Following the high body corresponding to the period high of 4381.29, the last two candlesticks have formed "turnover bars" with interlaced upper and lower shadows above 4290, signaling a shift in the bull-bear confrontation from a "trend-driven" one to a "positional game." As long as 4200.00 remains intact, the market can still be interpreted as a healthy consolidation within the rising channel.
Technical Conclusion: 4371-4381 constitutes the upper resistance band; 4290 is the dividing line between strength and weakness; 4200 is the primary support level; and the lower middle Bollinger band at 3936.91 is the medium-term trend lifeline. A break above 4381.29 and a firm hold will open up room for further upside extensions to new highs. A break below 4200 should alert the market to a medium-term trend shift to a box pattern or a deeper retracement.
From the perspective of group psychology and reflexivity, the bullish market sentiment for gold still prevails, but overheating signals are beginning to emerge:
(1) The price is close to the upper Bollinger Band and has repeatedly tested it, indicating a "high-level squeeze"; (2) The RSI has returned to 69.70, indicating a cooling of the willingness to chase the rise; (3) The MACD histogram is still positive but marginally decreasing, indicating a slowdown in momentum trading. At the same time, the two major narrative cores of risk aversion and interest rate cut expectations have not yet broken down, making it difficult for bearish market sentiment to form a synergistic force. The most sensitive variables in sentiment come from both ends: if US inflation unexpectedly rises and the US dollar and real interest rates rise in sync, it will trigger profit-taking and short-term squeezes; conversely, if inflation falls and policy becomes more dovish, the feeling of missing out may lead to a second rally.
1) Short-term (several days to two weeks)
Bullish path: If the inflation data does not constitute an upward surprise and the Fed's expectations remain dovish, the gold price is expected to complete consolidation and break through between 4290 and 4381. After breaking up, the target will be the outer expansion zone of the upper Bollinger band. The effectiveness of the breakthrough is based on "daily closing above 4381 and active trading."
Short-term scenario: If inflation exceeds expectations and the US dollar and real interest rates strengthen simultaneously, gold prices may retreat to test 4200.00. If 4200 falls, 3936.91 (the middle Bollinger band) will be the next key level to watch. This situation is likely to indicate a slowdown in the trend rather than an immediate reversal.
2) Mid-term (weeks to months)
Structural bullish: From a long-term perspective, gold prices have completed their upward trend after forming a large cup-and-handle pattern. A breakout above 4381.29 could theoretically target a range of 4800-5200 (corresponding to the linkage between trend continuation and rising risk premiums). This path relies on the unwavering macroeconomic combination of continued geopolitical uncertainty, declining inflation, and lower interest rates.
Risk scenario: If global growth is unexpectedly resilient and core inflation stickiness exceeds expectations, resulting in a postponement of interest rate cut pricing, gold will move into a high-level box or retreat in an orderly manner in the medium term, and the center of gravity may fall back to the 4200-3936 range and fluctuate repeatedly.
Fundamentals:
Recent fiscal and political uncertainty in the United States continues to linger, with the recurring risk of a government shutdown and the slow pace of fiscal negotiations disrupting economic data releases and expectations management. On the monetary policy front, market expectations for further Fed rate cuts persist, forming a "moderately dovish" psychological anchor alongside forward guidance. This limits the upward potential of real interest rates, favoring gold, a non-yielding asset. Meanwhile, geopolitical tensions remain, strengthening the value of safe-haven assets. Furthermore, any unexpected surprises in the upcoming US inflation report could trigger a repricing of the interest rate path, potentially significantly increasing short-term volatility.
At the dollar level, the temporary strength mainly comes from the resilience of the equity market and the stickiness of short-term yields, but this "strength" is more reflected in short-term suppression rather than a trend reversal: if inflation and growth weaken marginally, or the market re-strengthens the pricing of two interest rate cuts, the dollar's room for decline will be opened, and gold will gain additional momentum.
Technical aspects:
On the daily chart, core indicators provide a clear signal group of "slowing growth":
Bollinger Bands (BOLL 26,2): Middle Band 3936.91, Upper Band 4371.70, Lower Band 3502.12. The current price is trading within the upper-middle band, having repeatedly approached the upper band at 4371.70, indicating that the trend remains strong. However, the band has widened and entered a "high-level wandering" phase. Short-term trends are highly susceptible to a cycle of pullbacks, retests, and re-attacks near the upper band. Two key horizontal lines are also present on the chart: 4290 and 4200. The former corresponds to the "resistance-support conversion zone" that has recently seen heavy trading volume and the demarcation between bulls and bears, while the latter is a more stable static support level, serving as a "first buffer zone" for pullbacks.
MACD (26,12,9): DIFF 167.56, DEA 146.80, histogram 41.51. The DIFF and DEA remain positively expanding, indicating the mid-term uptrend remains intact. However, the slowdown in growth at the high end of the bar suggests a marginal weakening of momentum. If the DIFF and DEA subsequently converge toward the zero axis, a technical retracement could be triggered to release sluggish momentum. A prime indicator for this is the quality of the backtest between 4290 and 4200.
RSI (14): Located at 69.70, it has fallen back to the lower edge of the strong range. This is a typical picture of "cooling down from a high position without breaking the strong position": RSI retreats from the previous overbought zone to around 69.70, which is more indicative of a rhythm change rather than a trend reversal. If RSI turns upward again in the 65-70 area, it is often seen in the second force scenario of a strong trend.
K-line chart structure: Following the high body corresponding to the period high of 4381.29, the last two candlesticks have formed "turnover bars" with interlaced upper and lower shadows above 4290, signaling a shift in the bull-bear confrontation from a "trend-driven" one to a "positional game." As long as 4200.00 remains intact, the market can still be interpreted as a healthy consolidation within the rising channel.
Technical Conclusion: 4371-4381 constitutes the upper resistance band; 4290 is the dividing line between strength and weakness; 4200 is the primary support level; and the lower middle Bollinger band at 3936.91 is the medium-term trend lifeline. A break above 4381.29 and a firm hold will open up room for further upside extensions to new highs. A break below 4200 should alert the market to a medium-term trend shift to a box pattern or a deeper retracement.
Market sentiment observation:
From the perspective of group psychology and reflexivity, the bullish market sentiment for gold still prevails, but overheating signals are beginning to emerge:
(1) The price is close to the upper Bollinger Band and has repeatedly tested it, indicating a "high-level squeeze"; (2) The RSI has returned to 69.70, indicating a cooling of the willingness to chase the rise; (3) The MACD histogram is still positive but marginally decreasing, indicating a slowdown in momentum trading. At the same time, the two major narrative cores of risk aversion and interest rate cut expectations have not yet broken down, making it difficult for bearish market sentiment to form a synergistic force. The most sensitive variables in sentiment come from both ends: if US inflation unexpectedly rises and the US dollar and real interest rates rise in sync, it will trigger profit-taking and short-term squeezes; conversely, if inflation falls and policy becomes more dovish, the feeling of missing out may lead to a second rally.
Market outlook:
1) Short-term (several days to two weeks)
Bullish path: If the inflation data does not constitute an upward surprise and the Fed's expectations remain dovish, the gold price is expected to complete consolidation and break through between 4290 and 4381. After breaking up, the target will be the outer expansion zone of the upper Bollinger band. The effectiveness of the breakthrough is based on "daily closing above 4381 and active trading."
Short-term scenario: If inflation exceeds expectations and the US dollar and real interest rates strengthen simultaneously, gold prices may retreat to test 4200.00. If 4200 falls, 3936.91 (the middle Bollinger band) will be the next key level to watch. This situation is likely to indicate a slowdown in the trend rather than an immediate reversal.
2) Mid-term (weeks to months)
Structural bullish: From a long-term perspective, gold prices have completed their upward trend after forming a large cup-and-handle pattern. A breakout above 4381.29 could theoretically target a range of 4800-5200 (corresponding to the linkage between trend continuation and rising risk premiums). This path relies on the unwavering macroeconomic combination of continued geopolitical uncertainty, declining inflation, and lower interest rates.
Risk scenario: If global growth is unexpectedly resilient and core inflation stickiness exceeds expectations, resulting in a postponement of interest rate cut pricing, gold will move into a high-level box or retreat in an orderly manner in the medium term, and the center of gravity may fall back to the 4200-3936 range and fluctuate repeatedly.
- Risk Warning and Disclaimer
- The market involves risk, and trading may not be suitable for all investors. This article is for reference only and does not constitute personal investment advice, nor does it take into account certain users’ specific investment objectives, financial situation, or other needs. Any investment decisions made based on this information are at your own risk.