Everything is rising, but logic is missing: The dollar's paradoxical moment
2025-10-21 22:06:46
On Tuesday (October 21st), the US dollar index traded below 99 during the North American session. Currently, macroeconomic indicators are mixed, with the market focused on Friday's release of the US September CPI and next week's Federal Reserve interest rate decision. Bond yields have recently declined significantly, and the equity market has not been significantly pressured.
The historical correlations between global assets have recently been misaligned: the traditional chain of "rising risk appetite - falling bonds, falling gold, and diverging dollar gains/losses" has been disrupted, evolving into "rising risk assets and safe-haven assets." There are at least three possible paths at work: (1) the reallocation of some central bank reserves and sovereign funds, driving simultaneous buying of gold and high-grade bonds; (2) the private sector rebalancing duration and defensive assets before interest rates fall; and (3) momentum and follow-up driving "price-first" cross-asset resonance. For the US dollar, this means that the three traditional supports of "interest rate differentials - risk aversion - liquidity" have not completely collapsed: the decline in US nominal and real yields should have suppressed the US dollar; but when overseas growth momentum is generally weak, terminal interest rates in Europe and the UK are difficult to rise, and risk assets are fluctuating at high levels, the "passive demand" for the US dollar as a global settlement and financing currency remains.
The narrative surrounding the "currency devaluation trade" is receding. The simplistic scenario of "fiscal expansion + tariff-driven resurgence of inflation → medium-term dollar weakness" is currently failing to gain traction in both the bond and foreign exchange markets: US Treasury yields are declining, and the foreign exchange market isn't pricing in a rapid dollar depreciation. The key to inflation lies in structure, not rhetoric: if "perceived inflation" driven by food and energy exceeds core indicators, market receptivity to rate cuts will decline, and the dollar will weaken due to concerns about policy credibility. Conversely, if inflation readings are benign and the Fed emphasizes a "data-dependent and gradual" approach, then "lower interest rate differentials but predictable policy" creates a neutral to weak combination for the dollar, typically leading to a volatile oscillation around key technical levels rather than unilateral movement.
In terms of timing:
Friday: Market consensus is for a month-over-month CPI reading of around 0.4% and a core CPI reading of 0.3%. If the reading is "acceptable," the dollar is likely to maintain its structural resilience, while if it raises questions about whether a rate cut is premature, policy confidence could be undermined.
Next week: If the Fed meeting results in further easing and the wording emphasizes "continued observation", the impact on the US dollar will depend on whether the dot plot and forward guidance weaken the neutral interest rate spread - once overseas central banks become more dovish, the US dollar's relative advantage may still be retained.
From a cross-currency perspective, the Japanese yen remains constrained by interest rate differentials and carry flows, and will only have a stronger ability to rebound if US real yields accelerate downward. The Swiss franc is more sensitive to risk appetite, and if global risk aversion intensifies, the Swiss franc is more likely to gain marginal support relative to the US dollar. European and British currencies, driven by inconsistent growth and inflation in their respective economies, are unlikely to contribute systemic pressure to the US dollar in the short term. Overall, the US dollar's failure to fall despite its expected decline is the result of the combined force of multiple conflicting forces.
The daily chart shows the US Dollar Index in a gentle upward trend within its Bollinger Bands. The candlestick remains above the middle Bollinger Band at 98.1390, indicating the short-term bullish trend remains intact. The upper Bollinger Band at 99.5666 almost coincides with the near-term peak at 99.5549, forming the first level of momentum-price resonance resistance. A successful breakout would push the price towards the previously high of 100.2599. On the downside, the lower Bollinger Band at 96.7114 and the previous low at 96.2109 form the final line of defense within the range.
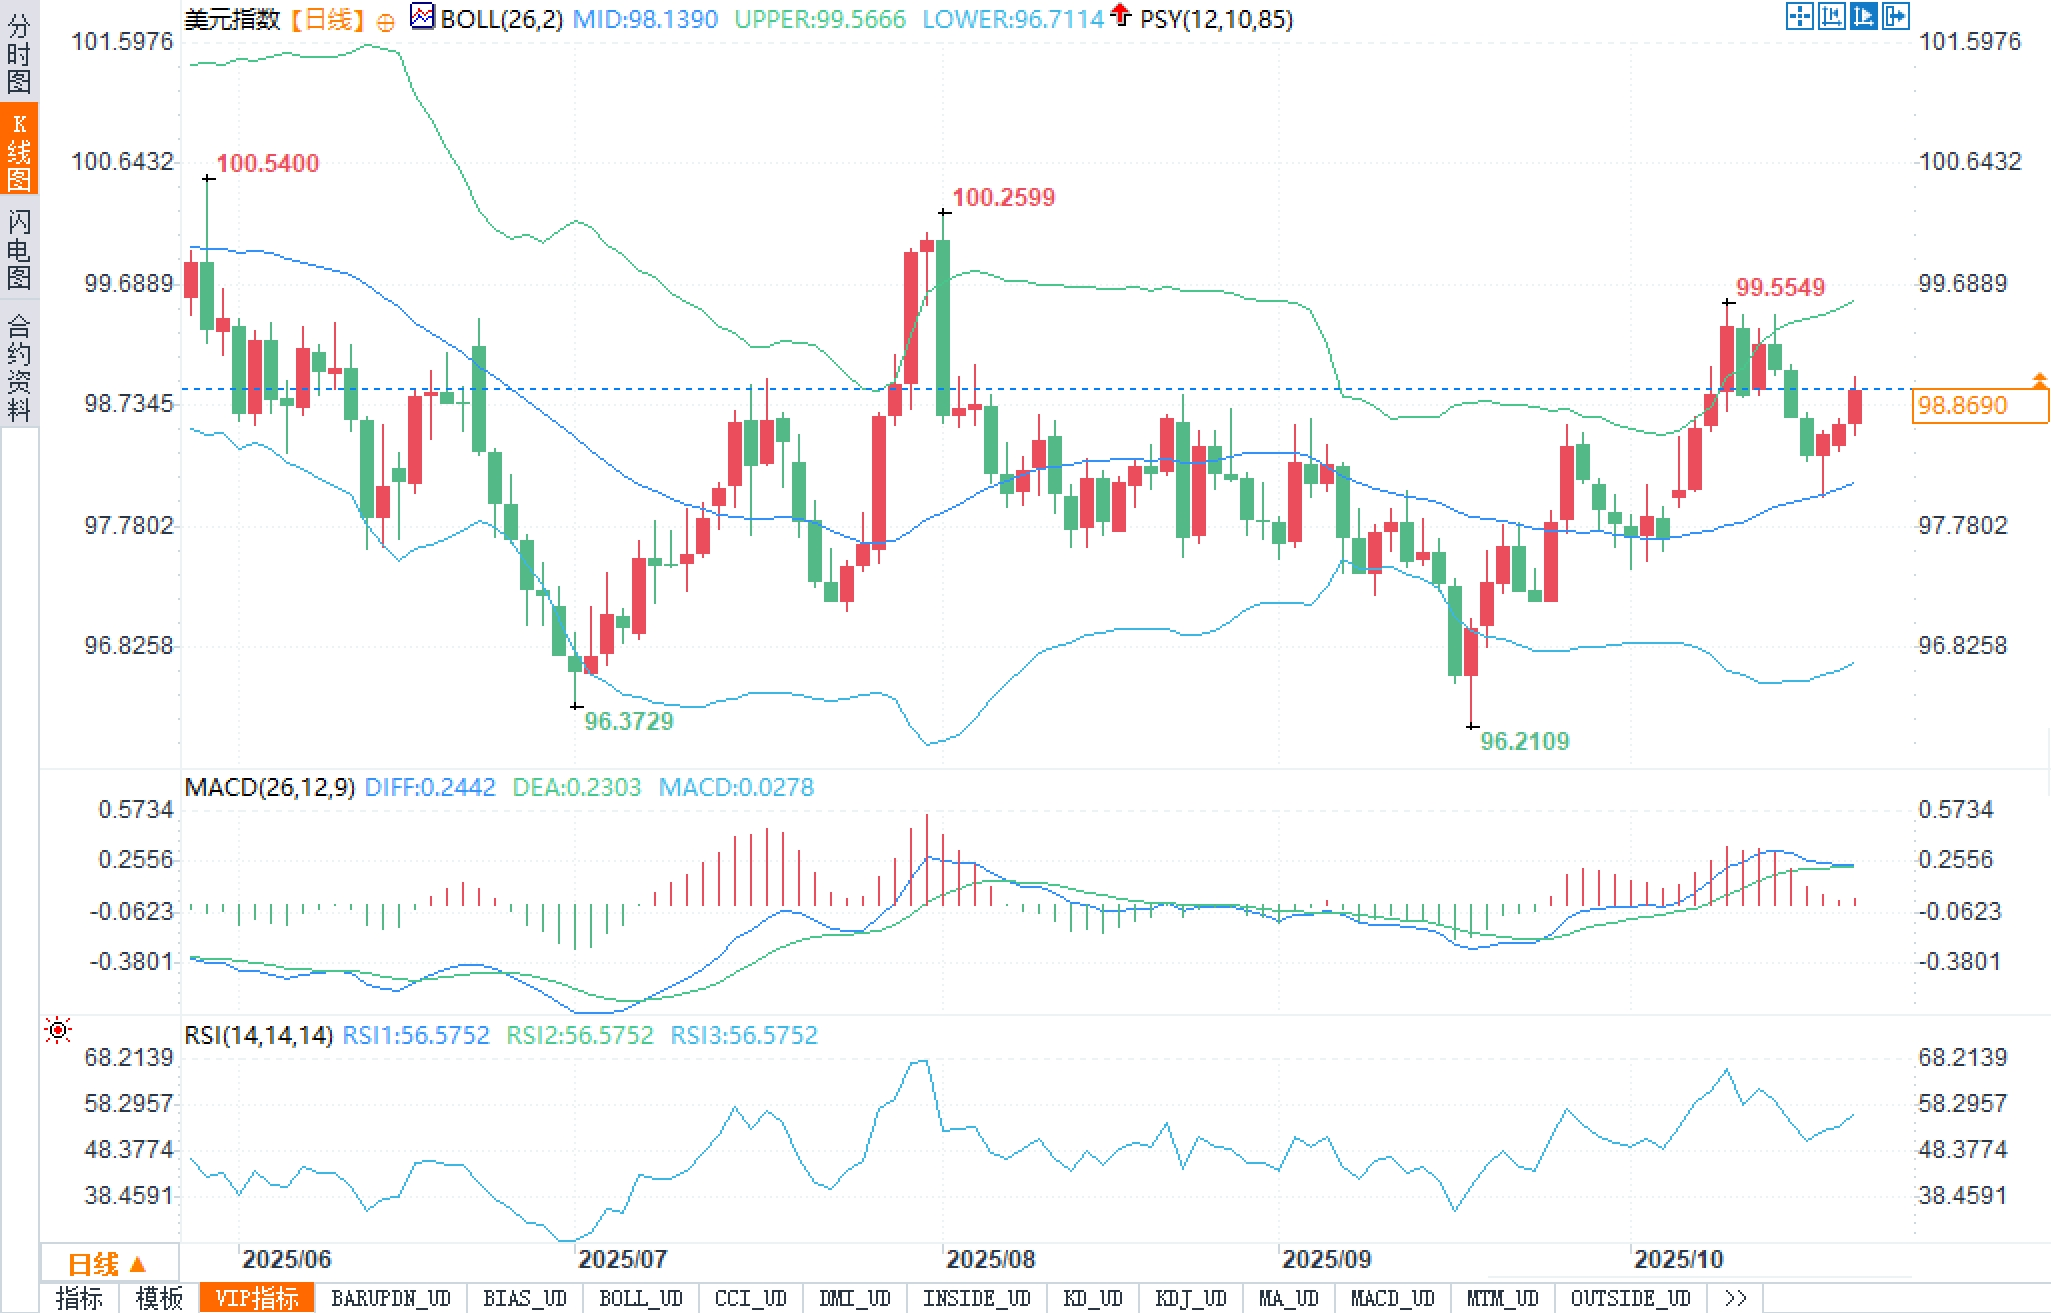
At the indicator level, the DIFF 0.2442 and DEA 0.2303 of MACD (26, 12, 9) are both above the zero axis, but the histogram 0.0278 shows that the upward momentum has begun to blunt, warning of short-term "high-level fluctuations due to insufficient volume"; RSI (14) is around 56.5752, in a moderately bullish range but not overbought. Comprehensive judgment: 98.1390 is the current trend dividing line between bulls and bears, and the upper 99.5549/99.5666 form a dense resistance band; if the retracement does not break through the middle line, it will still be "trend consolidation"; if it falls below the middle line, it will point to a retracement of the 96.7114-96.2109 range. The price structure has not yet formed a typical "head and shoulders top/triple top" pattern, and is currently closer to the situation of "repeated pressure testing at the upper edge of the box", with the box roughly located between 96.50 and 100.
Fundamentals
The historical correlations between global assets have recently been misaligned: the traditional chain of "rising risk appetite - falling bonds, falling gold, and diverging dollar gains/losses" has been disrupted, evolving into "rising risk assets and safe-haven assets." There are at least three possible paths at work: (1) the reallocation of some central bank reserves and sovereign funds, driving simultaneous buying of gold and high-grade bonds; (2) the private sector rebalancing duration and defensive assets before interest rates fall; and (3) momentum and follow-up driving "price-first" cross-asset resonance. For the US dollar, this means that the three traditional supports of "interest rate differentials - risk aversion - liquidity" have not completely collapsed: the decline in US nominal and real yields should have suppressed the US dollar; but when overseas growth momentum is generally weak, terminal interest rates in Europe and the UK are difficult to rise, and risk assets are fluctuating at high levels, the "passive demand" for the US dollar as a global settlement and financing currency remains.
The narrative surrounding the "currency devaluation trade" is receding. The simplistic scenario of "fiscal expansion + tariff-driven resurgence of inflation → medium-term dollar weakness" is currently failing to gain traction in both the bond and foreign exchange markets: US Treasury yields are declining, and the foreign exchange market isn't pricing in a rapid dollar depreciation. The key to inflation lies in structure, not rhetoric: if "perceived inflation" driven by food and energy exceeds core indicators, market receptivity to rate cuts will decline, and the dollar will weaken due to concerns about policy credibility. Conversely, if inflation readings are benign and the Fed emphasizes a "data-dependent and gradual" approach, then "lower interest rate differentials but predictable policy" creates a neutral to weak combination for the dollar, typically leading to a volatile oscillation around key technical levels rather than unilateral movement.
In terms of timing:
Friday: Market consensus is for a month-over-month CPI reading of around 0.4% and a core CPI reading of 0.3%. If the reading is "acceptable," the dollar is likely to maintain its structural resilience, while if it raises questions about whether a rate cut is premature, policy confidence could be undermined.
Next week: If the Fed meeting results in further easing and the wording emphasizes "continued observation", the impact on the US dollar will depend on whether the dot plot and forward guidance weaken the neutral interest rate spread - once overseas central banks become more dovish, the US dollar's relative advantage may still be retained.
From a cross-currency perspective, the Japanese yen remains constrained by interest rate differentials and carry flows, and will only have a stronger ability to rebound if US real yields accelerate downward. The Swiss franc is more sensitive to risk appetite, and if global risk aversion intensifies, the Swiss franc is more likely to gain marginal support relative to the US dollar. European and British currencies, driven by inconsistent growth and inflation in their respective economies, are unlikely to contribute systemic pressure to the US dollar in the short term. Overall, the US dollar's failure to fall despite its expected decline is the result of the combined force of multiple conflicting forces.
Technical aspects:
The daily chart shows the US Dollar Index in a gentle upward trend within its Bollinger Bands. The candlestick remains above the middle Bollinger Band at 98.1390, indicating the short-term bullish trend remains intact. The upper Bollinger Band at 99.5666 almost coincides with the near-term peak at 99.5549, forming the first level of momentum-price resonance resistance. A successful breakout would push the price towards the previously high of 100.2599. On the downside, the lower Bollinger Band at 96.7114 and the previous low at 96.2109 form the final line of defense within the range.
At the indicator level, the DIFF 0.2442 and DEA 0.2303 of MACD (26, 12, 9) are both above the zero axis, but the histogram 0.0278 shows that the upward momentum has begun to blunt, warning of short-term "high-level fluctuations due to insufficient volume"; RSI (14) is around 56.5752, in a moderately bullish range but not overbought. Comprehensive judgment: 98.1390 is the current trend dividing line between bulls and bears, and the upper 99.5549/99.5666 form a dense resistance band; if the retracement does not break through the middle line, it will still be "trend consolidation"; if it falls below the middle line, it will point to a retracement of the 96.7114-96.2109 range. The price structure has not yet formed a typical "head and shoulders top/triple top" pattern, and is currently closer to the situation of "repeated pressure testing at the upper edge of the box", with the box roughly located between 96.50 and 100.
- Risk Warning and Disclaimer
- The market involves risk, and trading may not be suitable for all investors. This article is for reference only and does not constitute personal investment advice, nor does it take into account certain users’ specific investment objectives, financial situation, or other needs. Any investment decisions made based on this information are at your own risk.