Gold Analysis: Turning Point or Noise? A Multiple Choice Question at $4,100
2025-10-23 20:52:44
On Thursday (October 23rd), spot gold traded above $4,100 before the US market opened. It had previously risen to $4,381.29 before retreating, with short-term pressure from a period of dollar strength. However, demand for macro hedging remained strong. Increased volatility in the equity market, weaker-than-expected earnings from some tech-heavy stocks, and sanctions against Russian energy companies all contributed to amplifying risk aversion. Meanwhile, market disagreements persisted regarding the Federal Reserve's policy path for the year and the stickiness of inflation, leading to a rapid rise followed by a deceleration in gold prices at high levels.
Recently, multiple cross-border policy uncertainties have resurfaced, with discussions of technology-related export restrictions heating up and risk premiums passively rising. New restrictions on Russia's energy sector have spilled over into commodity supply and demand expectations and transportation costs, increasing the pricing of geopolitical "tail risk." Meanwhile, several leading global technology companies released cautious quarterly reports, with earnings and guidance failing to boost market confidence. This has temporarily broken the "risk appetite-duration rate" link in the equity market, prompting institutional funds to shift back to defensive assets.
On the foreign exchange side, the temporary rebound of the US dollar has strengthened the upward constraints on the nominal prices of precious metals, but the "real interest rate" support for gold on the interest rate side has not been destroyed: the market still expects the Federal Reserve to maintain a gradual policy orientation centered on "data dependence" in the coming quarters. The uncertainty of the inflation path and the divergence of growth momentum provide a "steady-state chassis" for long-term allocation of gold.
From a central bank perspective, the diverging communication between the Federal Reserve and the European Central Bank and the Bank of England will continue to drive interest rate differentials and the direction of the US dollar. A slower-than-expected pace of policy normalization by the Bank of Japan could further complicate the trade-off between the yen's safe-haven properties and its yield. Overall, periodic fluctuations in policy rate differentials determine the "elasticity-resistance" cycle of gold's upward trajectory, while geopolitical and regulatory factors provide a "bottom-up" demand-side support.
The daily chart shows that after a strong upward move, the price encountered resistance at 4381.29, before retreating to the upper Bollinger Bands. Currently, the upper Bollinger Band is 4367.19, the middle Bollinger Band is 3964.72, and the lower Bollinger Band is 3562.26. The price is above the middle Bollinger Band but away from the upper Bollinger Band, demonstrating the typical characteristics of a "high-level pullback followed by strong consolidation." The shortening of the candlestick body and the increasing number of upper shadows indicate that selling pressure is becoming apparent from above. However, the longer the pullback remains above the previously important level of 4050, the more favorable it is for bulls.
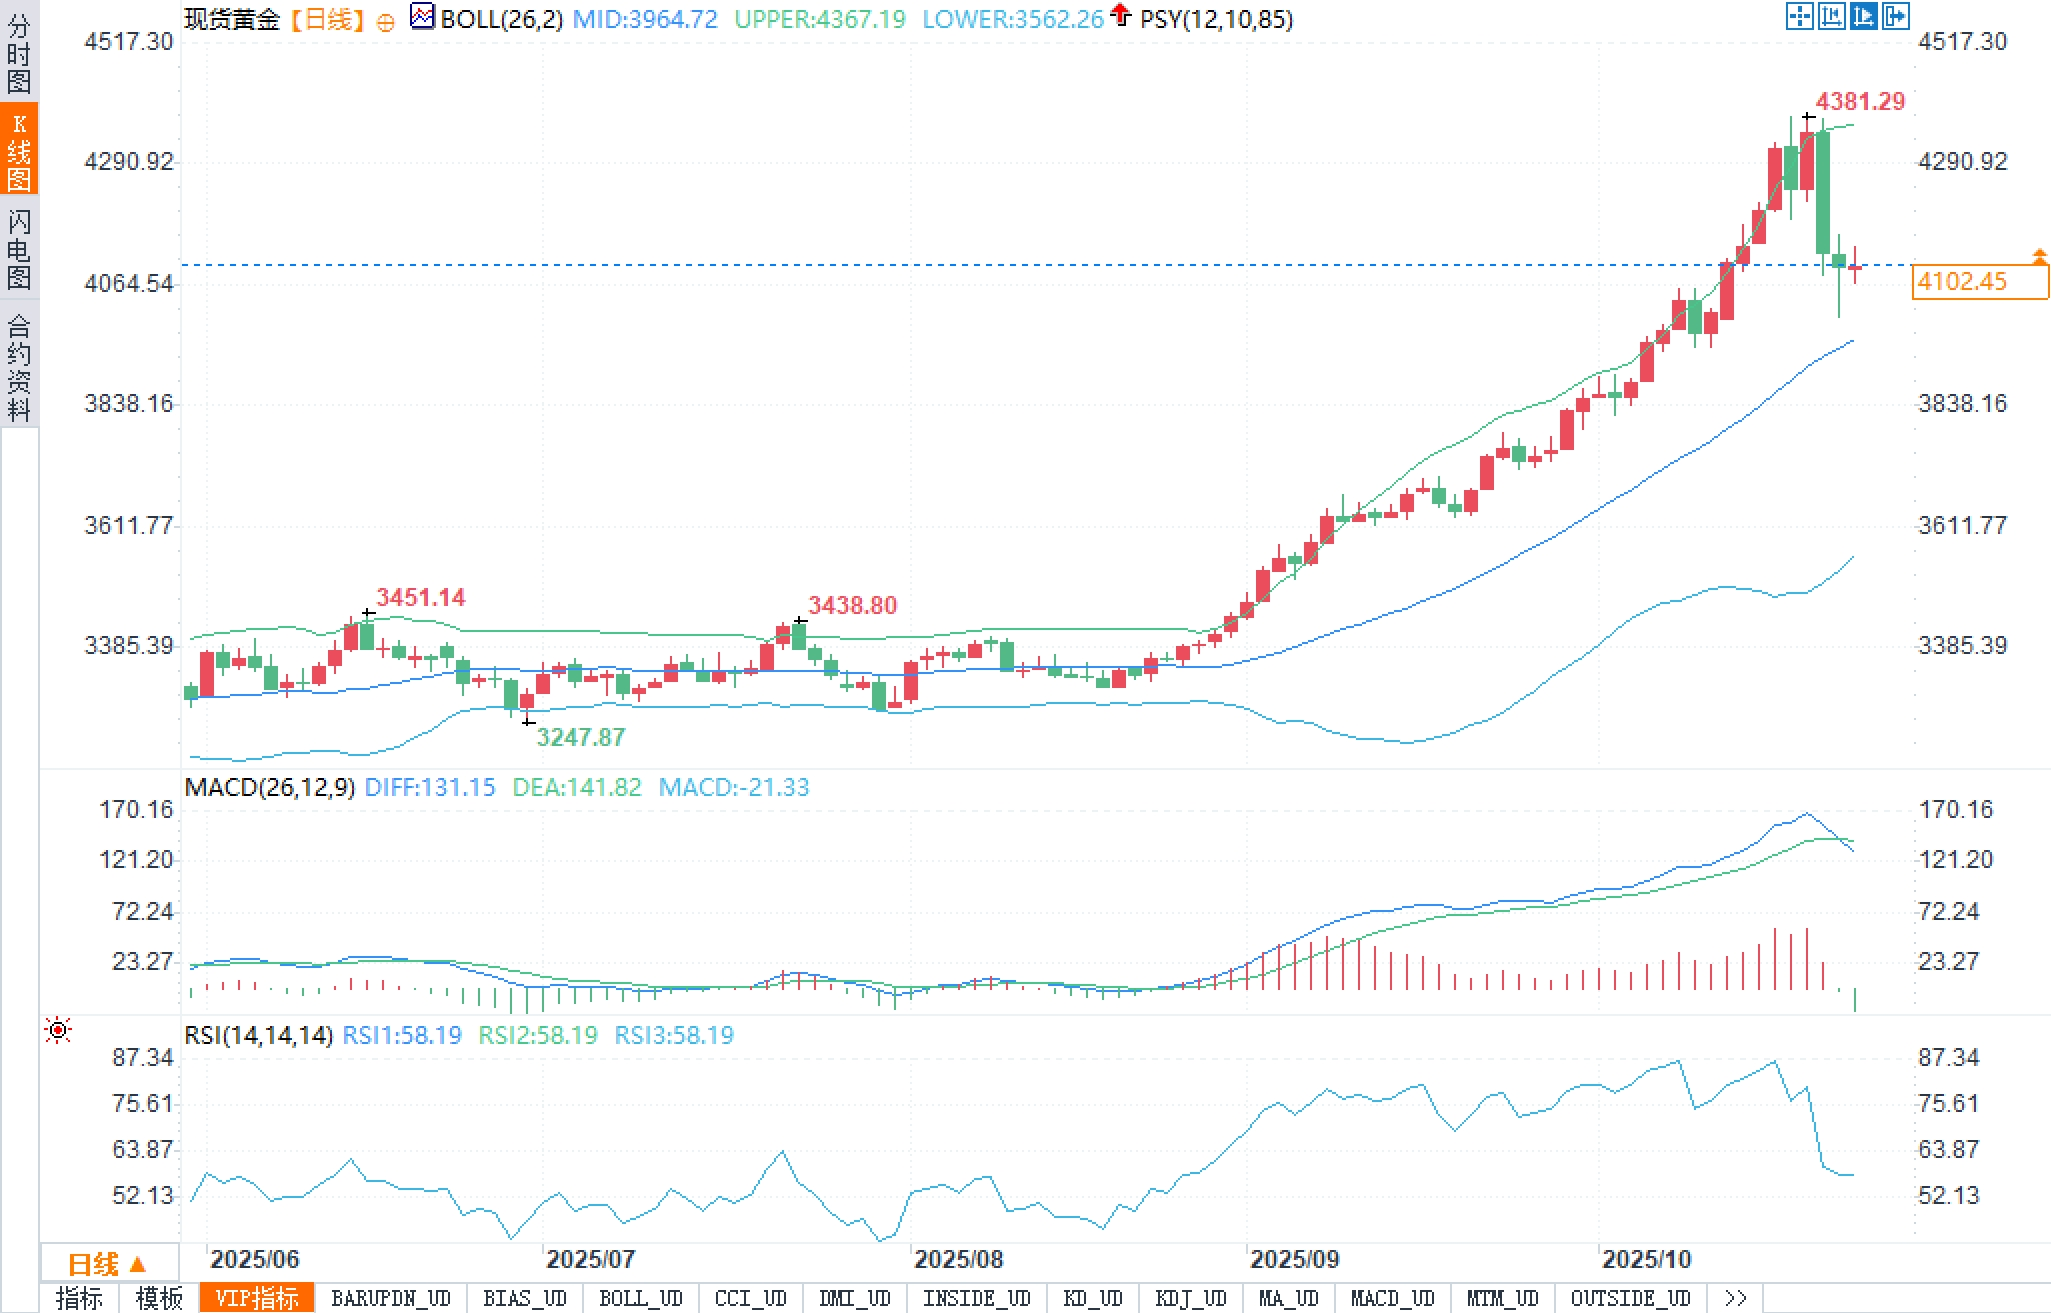
On the indicator side, the MACD (26, 12, 9) currently has a DIFF of 131.15, a DEA of 141.82, and a histogram of -21.33, indicating a "shrinking bar after a high-level divergence"—momentum is slowing but a trend reversal signal has not yet formed. A subsequent second golden cross above the zero axis will create conditions for an upward move. The Relative Strength Index (RSI) reading of 58.19 has retreated from the overbought zone to a mid-to-high level, indicating a "cooling down without breaking through" trend.
Overall, 4367.19-4381.29 constitutes a major resistance level, with 4300 acting as secondary resistance. Below this, 4050 provides primary support, followed by the middle Bollinger band at 3964.72. Further below, 3850 and 3611.77 offer medium-term structural support. As long as the price remains above 3964.72, the daily uptrend remains intact, and any pullbacks are more likely to signal a "mean reversion" to the previous surge.
Short-term (several days to a week): If US inflation and employment data weaken marginally and the Federal Reserve's communication is patient, a decline in the US dollar will release the nominal price elasticity of precious metals, and gold prices are expected to retest 4300 and further challenge the 4367.19-4381.29 range. However, if the data is temporarily strong or yields rise again, gold prices may retest 4050. If it fails, it will look to 3964.72 to confirm the trend is still intact.
Medium-term (one month to one quarter): If macro uncertainty and geopolitical disturbances persist, gold positioning will remain in a "buy on dips" mode. The upward trend above the middle line of 3964.72 may continue, targeting a new extension level above the previous high. Conversely, if major central banks simultaneously shift to a hawkish stance, rising real interest rates will compress gold's valuation, and the price may enter a longer-term consolidation range between 3850 and 3964.72.
Conclusion: Gold is entering a "strong consolidation-reselection" window near $4,100. To restart the trend, bulls need to consolidate their positions above $4,050 and drive a secondary uptrend through the resonance of volume and momentum. Bears seeking to dominate the market must break through $3,964.72 and extend the decline to $3,850 to potentially alter the medium-term bullish structure.
Fundamentals
Recently, multiple cross-border policy uncertainties have resurfaced, with discussions of technology-related export restrictions heating up and risk premiums passively rising. New restrictions on Russia's energy sector have spilled over into commodity supply and demand expectations and transportation costs, increasing the pricing of geopolitical "tail risk." Meanwhile, several leading global technology companies released cautious quarterly reports, with earnings and guidance failing to boost market confidence. This has temporarily broken the "risk appetite-duration rate" link in the equity market, prompting institutional funds to shift back to defensive assets.
On the foreign exchange side, the temporary rebound of the US dollar has strengthened the upward constraints on the nominal prices of precious metals, but the "real interest rate" support for gold on the interest rate side has not been destroyed: the market still expects the Federal Reserve to maintain a gradual policy orientation centered on "data dependence" in the coming quarters. The uncertainty of the inflation path and the divergence of growth momentum provide a "steady-state chassis" for long-term allocation of gold.
From a central bank perspective, the diverging communication between the Federal Reserve and the European Central Bank and the Bank of England will continue to drive interest rate differentials and the direction of the US dollar. A slower-than-expected pace of policy normalization by the Bank of Japan could further complicate the trade-off between the yen's safe-haven properties and its yield. Overall, periodic fluctuations in policy rate differentials determine the "elasticity-resistance" cycle of gold's upward trajectory, while geopolitical and regulatory factors provide a "bottom-up" demand-side support.
Technical aspects:
The daily chart shows that after a strong upward move, the price encountered resistance at 4381.29, before retreating to the upper Bollinger Bands. Currently, the upper Bollinger Band is 4367.19, the middle Bollinger Band is 3964.72, and the lower Bollinger Band is 3562.26. The price is above the middle Bollinger Band but away from the upper Bollinger Band, demonstrating the typical characteristics of a "high-level pullback followed by strong consolidation." The shortening of the candlestick body and the increasing number of upper shadows indicate that selling pressure is becoming apparent from above. However, the longer the pullback remains above the previously important level of 4050, the more favorable it is for bulls.
On the indicator side, the MACD (26, 12, 9) currently has a DIFF of 131.15, a DEA of 141.82, and a histogram of -21.33, indicating a "shrinking bar after a high-level divergence"—momentum is slowing but a trend reversal signal has not yet formed. A subsequent second golden cross above the zero axis will create conditions for an upward move. The Relative Strength Index (RSI) reading of 58.19 has retreated from the overbought zone to a mid-to-high level, indicating a "cooling down without breaking through" trend.
Overall, 4367.19-4381.29 constitutes a major resistance level, with 4300 acting as secondary resistance. Below this, 4050 provides primary support, followed by the middle Bollinger band at 3964.72. Further below, 3850 and 3611.77 offer medium-term structural support. As long as the price remains above 3964.72, the daily uptrend remains intact, and any pullbacks are more likely to signal a "mean reversion" to the previous surge.
Market Outlook
Short-term (several days to a week): If US inflation and employment data weaken marginally and the Federal Reserve's communication is patient, a decline in the US dollar will release the nominal price elasticity of precious metals, and gold prices are expected to retest 4300 and further challenge the 4367.19-4381.29 range. However, if the data is temporarily strong or yields rise again, gold prices may retest 4050. If it fails, it will look to 3964.72 to confirm the trend is still intact.
Medium-term (one month to one quarter): If macro uncertainty and geopolitical disturbances persist, gold positioning will remain in a "buy on dips" mode. The upward trend above the middle line of 3964.72 may continue, targeting a new extension level above the previous high. Conversely, if major central banks simultaneously shift to a hawkish stance, rising real interest rates will compress gold's valuation, and the price may enter a longer-term consolidation range between 3850 and 3964.72.
Conclusion: Gold is entering a "strong consolidation-reselection" window near $4,100. To restart the trend, bulls need to consolidate their positions above $4,050 and drive a secondary uptrend through the resonance of volume and momentum. Bears seeking to dominate the market must break through $3,964.72 and extend the decline to $3,850 to potentially alter the medium-term bullish structure.
- Risk Warning and Disclaimer
- The market involves risk, and trading may not be suitable for all investors. This article is for reference only and does not constitute personal investment advice, nor does it take into account certain users’ specific investment objectives, financial situation, or other needs. Any investment decisions made based on this information are at your own risk.