Gold stabilizes above $3,900 after falling to three-week low
2025-10-29 01:41:54
On Tuesday (October 28), spot gold stabilized after heavy selling pressure in early trading as investors continued to withdraw from safe-haven assets amid a rebound in risk appetite. Spot gold was trading around $3,968.67, down 0.31% on the day, after briefly falling below the $3,900 mark, its lowest level in three weeks.

The risk-on tone was helped by optimism about a potential trade truce between China and the United States, with market attention firmly focused on a meeting between U.S. President Donald Trump and Chinese President Xi Jinping scheduled for Thursday on the sidelines of the APEC summit in South Korea.
The precious metal has retreated about 10% from last week's all-time high of $4,381 as traders continue to lock in profits and rebalance portfolios after a historic rally. The pullback reflects a healthy corrective phase, with some investors rebalancing positions ahead of Wednesday's Federal Reserve interest rate decision.
The market is almost certain that the Federal Reserve will follow up its September 25 basis point rate cut with a second one, the first since December 2024. However, with the rate cut largely priced in, the focus will be on Fed Chairman Powell's speech. A dovish tone could revive demand for the non-yielding metal by reinforcing expectations of further monetary easing, while a hawkish bias could limit upside momentum and keep gold prices near recent lows.
Market drivers: Trade optimism dominates market sentiment
U.S. President Donald Trump expressed optimism about the outlook for trade on Monday after U.S. and Chinese negotiators reached a framework agreement over the weekend, setting the stage for an upcoming meeting between Trump and Xi Jinping.
The latest developments have eased concerns about a renewed escalation in the current trade truce before it expires on November 10. On Sunday, U.S. Treasury Secretary Jeffrey Besant said China would delay new rare earth export controls for a year and make “substantial” purchases of U.S. soybeans, while the threat of 100% tariffs on Chinese goods was now “effectively dead.”
On Tuesday, Trump held bilateral talks with Japanese Prime Minister Sanae Takaichi in Tokyo, focusing on trade and economic security. The two sides announced a new agreement on rare earth and critical minerals aimed at strengthening supply chains and reducing dependence on China. Japan also pledged to increase imports of American agricultural products and vehicles.
The United States also finalized new trade deals on Sunday with several Southeast Asian partners. These include reciprocal tariff agreements with Malaysia and Cambodia, and preliminary trade frameworks with Thailand and Vietnam.
Analysts expect gold prices to average $4,275 an ounce in 2026, according to a Reuters poll released on Monday. The survey of 39 analysts and traders also raised its 2025 forecast to $3,400 an ounce from $3,220 in July. The revised forecast reflects ongoing geopolitical uncertainty, strong central bank demand and expectations of further interest rate cuts from the Federal Reserve, which continue to support gold's long-term bullish outlook.
As of October 24, total global gold ETF holdings fell for the third consecutive week to 98.19 million ounces, marking the first weekly net outflow after eight consecutive weeks of inflows. Despite this, holdings remain near a three-year high and are still up 15.62% year-to-date.
Despite the recent sell-off, the overall outlook for gold remains positive. The ongoing U.S. government shutdown and ongoing geopolitical and economic uncertainty add to the cautious market backdrop, while expectations of lower interest rates suggest downside should be limited.
Technical analysis: Spot gold dips below $4,000 as bearish momentum builds
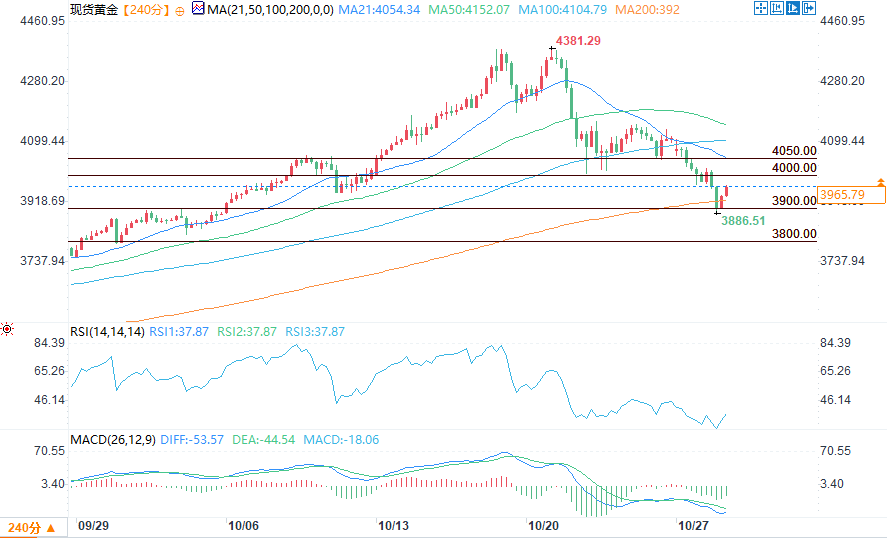
(Source of spot gold 4-hour chart: Yihuitong)
Gold's downtrend is continuing, with lower highs and lower lows being recorded on the 4-hour chart, suggesting that sellers remain in control. Gold is trading below the 21-period, 50-period, and 100-period simple moving averages (SMAs), with the 21-period SMA crossing below the 50-period and 100-period SMAs, confirming a firmly bearish short-term trend.
Immediate support is between $3,900 and $3,890, and a decisive break below this range could open the door to a further drop to the $3,800 area. On the upside, initial resistance is around $4,000, with stronger resistance between $4,050 and $4,150, where the moving averages converge and may limit any rebound attempts in the short term.
The Relative Strength Index (RSI) on the 4-hour chart is in oversold territory around 38, suggesting a possible short-term consolidation or mild rebound before the broader downtrend resumes. On the daily chart, the RSI has retreated from overbought levels to below 50, suggesting further downward pressure remains in the medium-term.
The risk-on tone was helped by optimism about a potential trade truce between China and the United States, with market attention firmly focused on a meeting between U.S. President Donald Trump and Chinese President Xi Jinping scheduled for Thursday on the sidelines of the APEC summit in South Korea.
The precious metal has retreated about 10% from last week's all-time high of $4,381 as traders continue to lock in profits and rebalance portfolios after a historic rally. The pullback reflects a healthy corrective phase, with some investors rebalancing positions ahead of Wednesday's Federal Reserve interest rate decision.
The market is almost certain that the Federal Reserve will follow up its September 25 basis point rate cut with a second one, the first since December 2024. However, with the rate cut largely priced in, the focus will be on Fed Chairman Powell's speech. A dovish tone could revive demand for the non-yielding metal by reinforcing expectations of further monetary easing, while a hawkish bias could limit upside momentum and keep gold prices near recent lows.
Market drivers: Trade optimism dominates market sentiment
U.S. President Donald Trump expressed optimism about the outlook for trade on Monday after U.S. and Chinese negotiators reached a framework agreement over the weekend, setting the stage for an upcoming meeting between Trump and Xi Jinping.
The latest developments have eased concerns about a renewed escalation in the current trade truce before it expires on November 10. On Sunday, U.S. Treasury Secretary Jeffrey Besant said China would delay new rare earth export controls for a year and make “substantial” purchases of U.S. soybeans, while the threat of 100% tariffs on Chinese goods was now “effectively dead.”
On Tuesday, Trump held bilateral talks with Japanese Prime Minister Sanae Takaichi in Tokyo, focusing on trade and economic security. The two sides announced a new agreement on rare earth and critical minerals aimed at strengthening supply chains and reducing dependence on China. Japan also pledged to increase imports of American agricultural products and vehicles.
The United States also finalized new trade deals on Sunday with several Southeast Asian partners. These include reciprocal tariff agreements with Malaysia and Cambodia, and preliminary trade frameworks with Thailand and Vietnam.
Analysts expect gold prices to average $4,275 an ounce in 2026, according to a Reuters poll released on Monday. The survey of 39 analysts and traders also raised its 2025 forecast to $3,400 an ounce from $3,220 in July. The revised forecast reflects ongoing geopolitical uncertainty, strong central bank demand and expectations of further interest rate cuts from the Federal Reserve, which continue to support gold's long-term bullish outlook.
As of October 24, total global gold ETF holdings fell for the third consecutive week to 98.19 million ounces, marking the first weekly net outflow after eight consecutive weeks of inflows. Despite this, holdings remain near a three-year high and are still up 15.62% year-to-date.
Despite the recent sell-off, the overall outlook for gold remains positive. The ongoing U.S. government shutdown and ongoing geopolitical and economic uncertainty add to the cautious market backdrop, while expectations of lower interest rates suggest downside should be limited.
Technical analysis: Spot gold dips below $4,000 as bearish momentum builds
(Source of spot gold 4-hour chart: Yihuitong)
Gold's downtrend is continuing, with lower highs and lower lows being recorded on the 4-hour chart, suggesting that sellers remain in control. Gold is trading below the 21-period, 50-period, and 100-period simple moving averages (SMAs), with the 21-period SMA crossing below the 50-period and 100-period SMAs, confirming a firmly bearish short-term trend.
Immediate support is between $3,900 and $3,890, and a decisive break below this range could open the door to a further drop to the $3,800 area. On the upside, initial resistance is around $4,000, with stronger resistance between $4,050 and $4,150, where the moving averages converge and may limit any rebound attempts in the short term.
The Relative Strength Index (RSI) on the 4-hour chart is in oversold territory around 38, suggesting a possible short-term consolidation or mild rebound before the broader downtrend resumes. On the daily chart, the RSI has retreated from overbought levels to below 50, suggesting further downward pressure remains in the medium-term.
- Risk Warning and Disclaimer
- The market involves risk, and trading may not be suitable for all investors. This article is for reference only and does not constitute personal investment advice, nor does it take into account certain users’ specific investment objectives, financial situation, or other needs. Any investment decisions made based on this information are at your own risk.