Experts are debating: Behind this surge in gold prices lies a startling, overlooked truth.
2025-11-03 16:59:21
Ken Fisher is the founder, executive chairman, and co-chief investment officer of Fisher Investments. He is known for his growth stock investment philosophy, which is based on a large and highly regarded client base and long-term market practice. He believes that gold's long-term annualized return is significantly lower than that of US stocks and that it is extremely volatile. Furthermore, he argues that it is not a good inflation hedge and that the reasons for the current rise in gold prices are insufficient.
John Tamney, an advisor in the field of gold standard research, argues, contrary to his views, that gold is the most stable indicator of inflation and the real value of the dollar (far exceeding the reference value of CPI).
At the same time, it added a new perspective: buying gold is essentially extracting resources from the private sector that creates wealth and information. This means that the private sector is where new money is created and new information is generated, while gold is where money is transferred without generating new value. Buying gold is taking money that should be used to create new value for the private sector and depositing it into gold, which is equivalent to extracting resources from the "source" of wealth creation.
There is a logic that rising gold prices take money away from the real economy, which is detrimental to the stock market. This also makes the funds used to buy gold and the funds used to buy stocks substitute for each other. Of course, from the perspective of risk appetite, the two are also substitutes. There have indeed been periods of this phenomenon in history.
Which side should we trust? In fact, each has its own reasons, but the core argument of this article is still: why did gold fail to function as a stock market indicator this time, and why did gold and stocks rise together?
This article explains why gold prices and stocks rose together by comparing the two perspectives.
Fisher argues that gold is not a good inflation hedge. He cites 2022 as evidence: when the Consumer Price Index (CPI) reached a 40-year high, gold prices fell even more than the stock market during the same period.
This viewpoint is quite reasonable, but it also confirms the point made in this article that gold prices are the most stable indicator of inflation, and that the price fluctuations in 2022 were not inflation.
Rising prices are not the same as inflation, because inflation is a price increase caused by excessive money supply, while rising prices are not necessarily caused by excessive money supply.
At the time, prices of various consumer goods did indeed soar, but this price increase stemmed from the breakdown of the global producer collaboration system (such as the global lockdown measures led by then-US President Trump in 2020), which ultimately led to a sharp decline in production efficiency.
Reduced input of manpower and equipment in production and loss of collaborative efficiency naturally drive up prices. However, this directive control model only leads to price increases, not inflation itself caused by excessive money supply.
Although 1974 was indeed a landmark year in which the United States lifted the gold standard, the market rarely waits for the final implementation of policy decisions.
In 1974, the average price of gold was $158 per ounce. In 1971, President Nixon initiated the process of decoupling the dollar from gold, at which time the price of gold was slightly above $35 per ounce. By the end of the 1970s, the price of gold had climbed to $513 per ounce; and in late January 1980, it reached a historical peak of $875 per ounce.
The price trend during this stage represents the true inflation; rising consumer goods prices are merely an external manifestation of inflation.
If gold is considered the most reliable indicator of inflation, then the stock market's poor performance in the 1970s (annualized return of only 1.6%, while the price of gold increased 24 times) is a stark contrast.
Conversely, during the 1980s and 1990s, gold prices continued to decline (inflation was effectively contained), while the US stock market rose sharply—because funds were withdrawn from the so-called "coffee cans" (i.e. idle savings) and reinvested in the real wealth creation sector.
If gold is positioned as the core standard for measuring inflation and a "barometer" reflecting the true value of the dollar, while the Consumer Price Index (CPI) can at best only reflect the impact of inflation, then it is reasonable to conclude that the so-called "Biden inflation" is not true, and that inflation during the Nixon, Ford, and Carter administrations, as well as during the Bush and Obama administrations, was real.
From this perspective, gold's role as both an inflation hedge and a signal of the damage that monetary policy mistakes can inflict on the economy becomes increasingly clear.
In the early 21st century (2000-2009) under President George W. Bush, the dollar entered another period of depreciation, measured against gold.
At the end of this period (2009), the price of gold closed at $1,226 per ounce, compared to only $266 per ounce in 2000—meaning a return of 360%, while the S&P 500 index fell by 0.95% between January 31, 2000 and December 31, 2009. This demonstrates a substitution effect between gold and the stock market due to differences in risk appetite.
Although the stock market also rose at one point and experienced a rebound after the dot-com bubble, the safe-haven properties of gold during this period have genuinely drawn funds away from stock investment, resulting in the overall stock market performance remaining relatively flat over the past 10 years.
Fast forward to 2025: Despite gold prices being at historic highs, causing concern among market participants who see them as the strongest signal of inflation, gold prices have only increased 1.6 times since 2020—significantly lower than the increases seen in the 1970s and early 21st century.
Despite concerns raised by the rise in gold prices—which imply expectations of a weaker dollar—the gains are still moderate compared to historical increases for the same period.
This phenomenon may explain why the stock market can remain strong during a gold price rally, while also raising a "hidden" question: if the US dollar index and the actual inflation level in the United States continue to deteriorate, gold may still have considerable upside potential.
The common reasons that previously drove up gold and stock prices include rising real inflation or declining credit for the US dollar.
The reason why the two have tended to diverge in the past is that the stock market represents funds with a high risk appetite, while gold represents funds that seek safe haven, and they are substitutes for each other in terms of funds.
Currently, the recent rapid rise in gold prices is indeed inextricably linked to the increase in real inflation and the decline in the credibility of the US dollar, while also being compounded by central bank gold purchases and geopolitical threats.
However, the continuous rise in gold prices has weakened its safe-haven function. Both the stock market and the continuously rising gold have become high-risk assets. At the same time, the stock market is also accelerating its upward trend and needs funds. It has not diverged as usual. As a result, the alternative funds available for purchasing gold have decreased. Therefore, based on historical experience, investors should be highly vigilant when gold prices rise against the backdrop of rising stocks. This correction is reasonable.
In conclusion, later-stage traders can gain important guidance on gold's price movement by observing US inflation and analyzing the position of the US dollar index and the overall US stock market. That is, a correction in gold's price movement would facilitate the return of its safe-haven attributes, or a deterioration in inflation and the US dollar index could also restore some of its safe-haven attributes.
The daily chart for spot gold shows that the price tested 3972 twice and found support both times. Therefore, this level remains the most important support in the short term. If the price approaches 3972 again, it may indicate the end of the rebound, and the price may go to around 3886 to find a bottom.
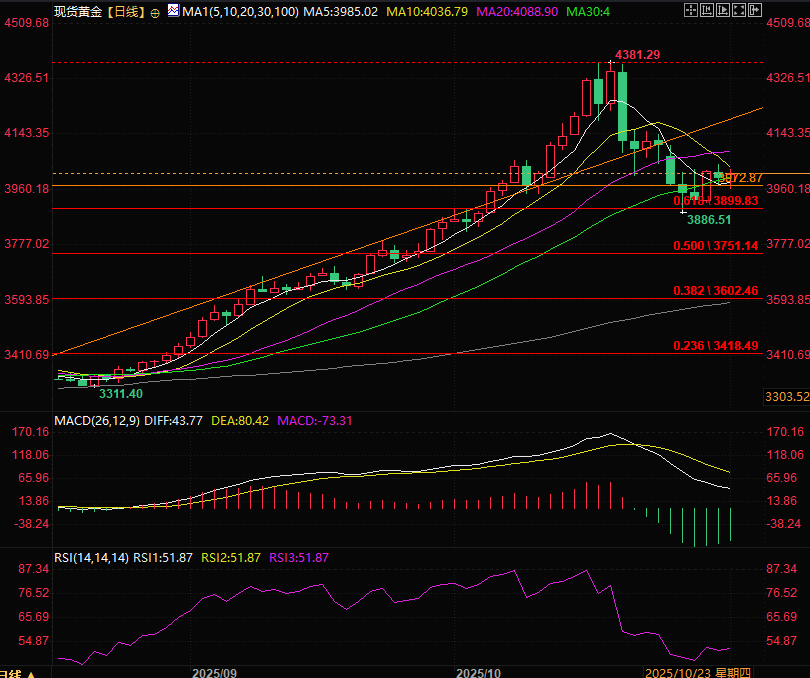
(Spot gold daily chart, source: FX678)
At 16:44 Beijing time, spot gold was trading at $4015.94 per ounce.
John Tamney, an advisor in the field of gold standard research, argues, contrary to his views, that gold is the most stable indicator of inflation and the real value of the dollar (far exceeding the reference value of CPI).
At the same time, it added a new perspective: buying gold is essentially extracting resources from the private sector that creates wealth and information. This means that the private sector is where new money is created and new information is generated, while gold is where money is transferred without generating new value. Buying gold is taking money that should be used to create new value for the private sector and depositing it into gold, which is equivalent to extracting resources from the "source" of wealth creation.
There is a logic that rising gold prices take money away from the real economy, which is detrimental to the stock market. This also makes the funds used to buy gold and the funds used to buy stocks substitute for each other. Of course, from the perspective of risk appetite, the two are also substitutes. There have indeed been periods of this phenomenon in history.
Which side should we trust? In fact, each has its own reasons, but the core argument of this article is still: why did gold fail to function as a stock market indicator this time, and why did gold and stocks rise together?
This article explains why gold prices and stocks rose together by comparing the two perspectives.
The relationship between gold and inflation: False inflation cannot drive up gold prices.
Fisher argues that gold is not a good inflation hedge. He cites 2022 as evidence: when the Consumer Price Index (CPI) reached a 40-year high, gold prices fell even more than the stock market during the same period.
This viewpoint is quite reasonable, but it also confirms the point made in this article that gold prices are the most stable indicator of inflation, and that the price fluctuations in 2022 were not inflation.
Rising prices are not the same as inflation, because inflation is a price increase caused by excessive money supply, while rising prices are not necessarily caused by excessive money supply.
At the time, prices of various consumer goods did indeed soar, but this price increase stemmed from the breakdown of the global producer collaboration system (such as the global lockdown measures led by then-US President Trump in 2020), which ultimately led to a sharp decline in production efficiency.
Reduced input of manpower and equipment in production and loss of collaborative efficiency naturally drive up prices. However, this directive control model only leads to price increases, not inflation itself caused by excessive money supply.
The gold logic of the 1970s-1990s: Real inflation fuels gold price increases.
Although 1974 was indeed a landmark year in which the United States lifted the gold standard, the market rarely waits for the final implementation of policy decisions.
In 1974, the average price of gold was $158 per ounce. In 1971, President Nixon initiated the process of decoupling the dollar from gold, at which time the price of gold was slightly above $35 per ounce. By the end of the 1970s, the price of gold had climbed to $513 per ounce; and in late January 1980, it reached a historical peak of $875 per ounce.
The price trend during this stage represents the true inflation; rising consumer goods prices are merely an external manifestation of inflation.
If gold is considered the most reliable indicator of inflation, then the stock market's poor performance in the 1970s (annualized return of only 1.6%, while the price of gold increased 24 times) is a stark contrast.
Conversely, during the 1980s and 1990s, gold prices continued to decline (inflation was effectively contained), while the US stock market rose sharply—because funds were withdrawn from the so-called "coffee cans" (i.e. idle savings) and reinvested in the real wealth creation sector.
Two Dimensions of Inflation Measurement: Verifying the Difference Between CPI and Gold Prices
If gold is positioned as the core standard for measuring inflation and a "barometer" reflecting the true value of the dollar, while the Consumer Price Index (CPI) can at best only reflect the impact of inflation, then it is reasonable to conclude that the so-called "Biden inflation" is not true, and that inflation during the Nixon, Ford, and Carter administrations, as well as during the Bush and Obama administrations, was real.
From this perspective, gold's role as both an inflation hedge and a signal of the damage that monetary policy mistakes can inflict on the economy becomes increasingly clear.
The dollar depreciation cycle in the early 21st century: both gold and stocks benefited and there was a substitution relationship between them.
In the early 21st century (2000-2009) under President George W. Bush, the dollar entered another period of depreciation, measured against gold.
At the end of this period (2009), the price of gold closed at $1,226 per ounce, compared to only $266 per ounce in 2000—meaning a return of 360%, while the S&P 500 index fell by 0.95% between January 31, 2000 and December 31, 2009. This demonstrates a substitution effect between gold and the stock market due to differences in risk appetite.
Although the stock market also rose at one point and experienced a rebound after the dot-com bubble, the safe-haven properties of gold during this period have genuinely drawn funds away from stock investment, resulting in the overall stock market performance remaining relatively flat over the past 10 years.
Analysis of Gold's High Levels in 2025: Price Increase Comparison and Hidden Issues
Fast forward to 2025: Despite gold prices being at historic highs, causing concern among market participants who see them as the strongest signal of inflation, gold prices have only increased 1.6 times since 2020—significantly lower than the increases seen in the 1970s and early 21st century.
Despite concerns raised by the rise in gold prices—which imply expectations of a weaker dollar—the gains are still moderate compared to historical increases for the same period.
This phenomenon may explain why the stock market can remain strong during a gold price rally, while also raising a "hidden" question: if the US dollar index and the actual inflation level in the United States continue to deteriorate, gold may still have considerable upside potential.
Key Conclusion: The Warning Significance of Gold Signals for Investors
The common reasons that previously drove up gold and stock prices include rising real inflation or declining credit for the US dollar.
The reason why the two have tended to diverge in the past is that the stock market represents funds with a high risk appetite, while gold represents funds that seek safe haven, and they are substitutes for each other in terms of funds.
Currently, the recent rapid rise in gold prices is indeed inextricably linked to the increase in real inflation and the decline in the credibility of the US dollar, while also being compounded by central bank gold purchases and geopolitical threats.
However, the continuous rise in gold prices has weakened its safe-haven function. Both the stock market and the continuously rising gold have become high-risk assets. At the same time, the stock market is also accelerating its upward trend and needs funds. It has not diverged as usual. As a result, the alternative funds available for purchasing gold have decreased. Therefore, based on historical experience, investors should be highly vigilant when gold prices rise against the backdrop of rising stocks. This correction is reasonable.
In conclusion, later-stage traders can gain important guidance on gold's price movement by observing US inflation and analyzing the position of the US dollar index and the overall US stock market. That is, a correction in gold's price movement would facilitate the return of its safe-haven attributes, or a deterioration in inflation and the US dollar index could also restore some of its safe-haven attributes.
The daily chart for spot gold shows that the price tested 3972 twice and found support both times. Therefore, this level remains the most important support in the short term. If the price approaches 3972 again, it may indicate the end of the rebound, and the price may go to around 3886 to find a bottom.
(Spot gold daily chart, source: FX678)
At 16:44 Beijing time, spot gold was trading at $4015.94 per ounce.
- Risk Warning and Disclaimer
- The market involves risk, and trading may not be suitable for all investors. This article is for reference only and does not constitute personal investment advice, nor does it take into account certain users’ specific investment objectives, financial situation, or other needs. Any investment decisions made based on this information are at your own risk.