Trend in hand, momentum weakening: Can crude oil rise to a new level thanks to geopolitical premium?
2025-11-05 19:59:21
On Wednesday (November 5), WTI crude oil (the main contract) traded around $60.70 during the European session; earlier, the price approached $60.00 before rebounding. The market exhibited a mixed pattern of "bearish data - bullish geopolitics - technical correction," with the short-term dominant factor shifting to the EIA commercial crude oil inventory data released that evening.

The latest industry association data shows that U.S. commercial crude oil inventories increased by approximately 6.5 million barrels, compared to a decrease of approximately 4 million barrels the previous week. Extrapolating to the year-to-date total, inventories have increased by approximately 3.6 million barrels. This further accumulation of inventories puts a bearish impact on crude oil itself. However, the significant decline in gasoline and distillate fuel inventories has improved refinery cracking margins, and the resilience of refined products indirectly supports the crude oil supply chain. This means that even with passive inventory accumulation in crude oil, the demand elasticity of refined oil products can still offset some of the pressure and curb the rapid decline in oil prices.
Geopolitically, Ukraine has increased the frequency of attacks on Russian energy facilities, including a declaratory strike on the Norsi refinery in Nizhny Novgorod (with a processing capacity of approximately 340,000 barrels per day) and disruptions to facilities in Tuapse and Saratov. While the sustainability of actual capacity losses remains to be seen, the expectation of supply disruptions alone can support oil prices through risk premiums. Furthermore, any marginal escalation of shipping routes in the Middle East and Black Sea could further amplify supply-side uncertainty.
In summary, inventory accumulation is bearish, while geopolitical disturbances and refined oil inventory reduction are bullish. These two forces create a seesaw effect in the short term, making the market more inclined to seek equilibrium within the range before the EIA report is released.
The 30-minute candlestick chart shows that the price has been oscillating and rebounding along the upward trend line since the low of 60.01. Currently, the price is retracing and moving upwards along the trend line, repeatedly testing the 60.77 level during the session. The lower level of 60.40 provides static support, forming a "convergence support zone" with the sloping trend line. The resistance structure above is clear: the previous high of 60.89 and the latest high of 61.09 form a double resistance, and above this level lies a short-term vacuum zone. The authenticity of any breakout and the effectiveness of any subsequent pullback are crucial.
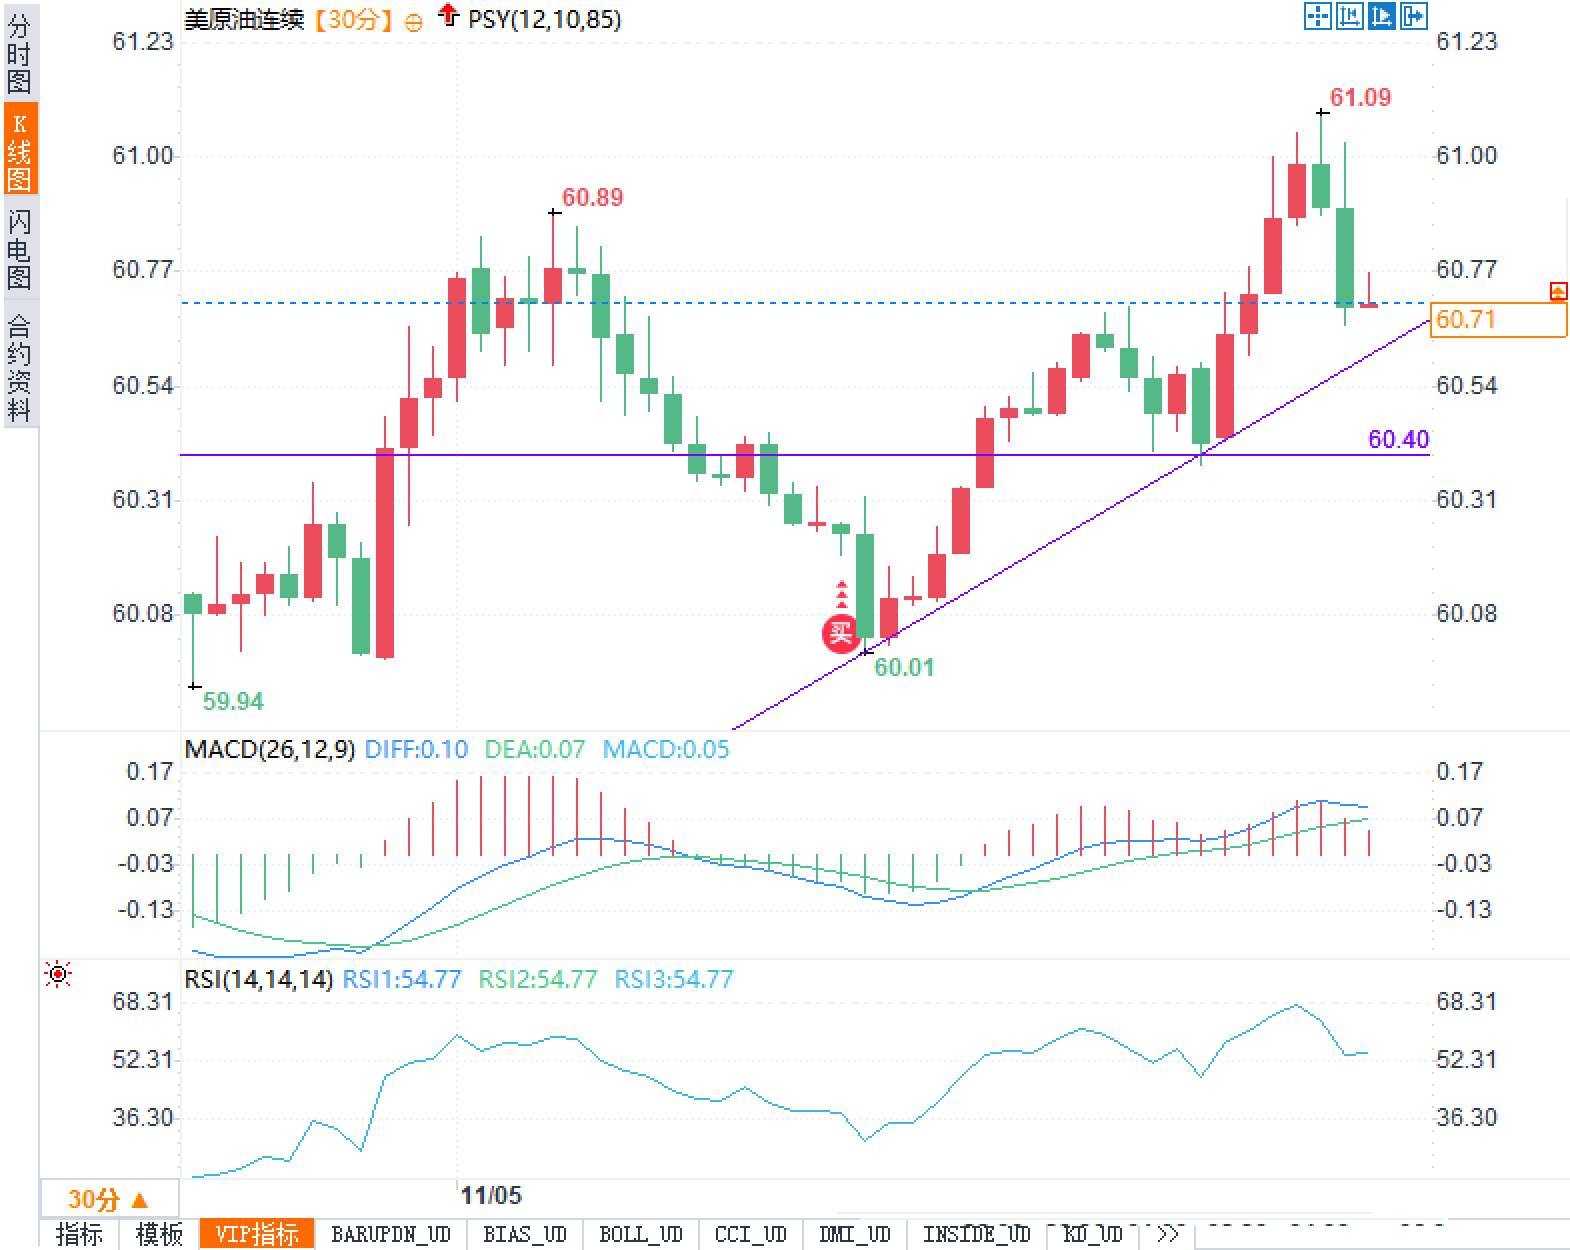
The MACD indicator is above the zero axis, DIFF=0.10, DEA=0.07, and the histogram is positive and shortening, indicating that the upward momentum is still there but is slowing down at the margin; if the histogram continues to narrow until it turns green, it will constitute an early signal of momentum divergence. RSI(14)=54.77, which is in the neutral to strong range, indicating that it is not extremely overbought, leaving room for the continuation of the technical rebound. Structurally, the 60.40-60.77 range is the short-term watershed between bulls and bears: if it holds, it will look to hit 61.00/61.09; if it does not break the high, it will return to the box; if it breaks down, it will open the channel to test 60.01-59.94. The overall characterization is: short-term trend upward, momentum slowing down, key level game.
From the perspective of group psychology and reflexivity, the API's "further inventory buildup" provided a basis for a bearish narrative, but the destocking of refined oil products and geopolitical disturbances created a complex sentiment of "good structure within bad news." This is reflected in the market as follows:
The swings between fear and greed are converging – there is an increase in sideways trading between 60.40 and 60.77, and liquidity is concentrated near key price levels;
Volatility has declined marginally but remains highly sensitive to news – prior to the EIA report, the market is reluctant to price in significantly in advance and instead uses options hedging and spread strategies to reduce net directional exposure.
Improved crack spreads have led to a coexistence of "structural bullishness" and "overall bearishness," resulting in a high probability of the continuation of the consolidation market.
Therefore, the current market consensus can be summarized as: remaining cautious about inventory accumulation and maintaining flexibility in expectations regarding geopolitics and the refined oil supply chain. Such consensus often leads to rapid repricing after the actual EIA data is released, resulting in a significant increase in the frequency of short-term false breakouts and pullbacks for confirmation.
Short-term scenario (with EIA as the dividing line)
The likely path for a rebound: If the EIA report does not replicate a significant increase in inventory, or if there is a slight increase or unexpected decrease in inventory, coupled with continued geopolitical disturbances, the probability of a return of momentum above 60.77 increases, and the price may retest 61.00 and challenge 61.09; if it breaks through effectively and completes a pullback confirmation, the short-term trend may enter a breakout-consolidation-breakout rhythm, and volatility may expand again.
A potential downward path: If the EIA confirms significant inventory accumulation and geopolitical tensions ease, it will be difficult to hold above 60.77. A break below 60.40 and the trendline would trigger a technical downtrend, targeting 60.01. Further attention should be paid to the support strength and probability of a false break below the previous low of 59.94. In this scenario, a weakening MACD above the zero line and an RSI falling below 50 would be simultaneous signals of a shift in momentum.
Mid-term perspective (several weeks)
Inventory cycles, refinery maintenance schedules, and geopolitical variables collectively determine the upper and lower limits of the trading range. If inventories continue to accumulate while refined product inventory reduction slows marginally, bullish market sentiment will struggle to develop, and oil prices are likely to form resistance near the previous high of $61.09, reverting to mean reversion within the trading range. Conversely, if inventories shift from accumulation to decline, coupled with supply disruptions, the $60 level will gradually evolve into a support zone, and the upper resistance level is expected to be broken through by increased trading volume.
With inventory accumulation and geopolitical disturbances offsetting each other, the 60.40-60.77 range forms a short-term "price magnet." If the EIA report fails to further disprove the rebound logic, prices are likely to test 61.00/61.09 for a breakout confirmation. If inventory accumulation exceeds expectations or geopolitical tensions ease marginally, the trend line at 60.40 will be tested, and a break below this level increases the probability of a pullback to 60.01-59.94. For professional traders, the current phase is more like waiting for a "confirmation signal": the validity of the price level and the sustainability of the momentum will determine whether the next move is a trend extension or a mean reversion.
Fundamentals:
The latest industry association data shows that U.S. commercial crude oil inventories increased by approximately 6.5 million barrels, compared to a decrease of approximately 4 million barrels the previous week. Extrapolating to the year-to-date total, inventories have increased by approximately 3.6 million barrels. This further accumulation of inventories puts a bearish impact on crude oil itself. However, the significant decline in gasoline and distillate fuel inventories has improved refinery cracking margins, and the resilience of refined products indirectly supports the crude oil supply chain. This means that even with passive inventory accumulation in crude oil, the demand elasticity of refined oil products can still offset some of the pressure and curb the rapid decline in oil prices.
Geopolitically, Ukraine has increased the frequency of attacks on Russian energy facilities, including a declaratory strike on the Norsi refinery in Nizhny Novgorod (with a processing capacity of approximately 340,000 barrels per day) and disruptions to facilities in Tuapse and Saratov. While the sustainability of actual capacity losses remains to be seen, the expectation of supply disruptions alone can support oil prices through risk premiums. Furthermore, any marginal escalation of shipping routes in the Middle East and Black Sea could further amplify supply-side uncertainty.
In summary, inventory accumulation is bearish, while geopolitical disturbances and refined oil inventory reduction are bullish. These two forces create a seesaw effect in the short term, making the market more inclined to seek equilibrium within the range before the EIA report is released.
Technical aspects:
The 30-minute candlestick chart shows that the price has been oscillating and rebounding along the upward trend line since the low of 60.01. Currently, the price is retracing and moving upwards along the trend line, repeatedly testing the 60.77 level during the session. The lower level of 60.40 provides static support, forming a "convergence support zone" with the sloping trend line. The resistance structure above is clear: the previous high of 60.89 and the latest high of 61.09 form a double resistance, and above this level lies a short-term vacuum zone. The authenticity of any breakout and the effectiveness of any subsequent pullback are crucial.
The MACD indicator is above the zero axis, DIFF=0.10, DEA=0.07, and the histogram is positive and shortening, indicating that the upward momentum is still there but is slowing down at the margin; if the histogram continues to narrow until it turns green, it will constitute an early signal of momentum divergence. RSI(14)=54.77, which is in the neutral to strong range, indicating that it is not extremely overbought, leaving room for the continuation of the technical rebound. Structurally, the 60.40-60.77 range is the short-term watershed between bulls and bears: if it holds, it will look to hit 61.00/61.09; if it does not break the high, it will return to the box; if it breaks down, it will open the channel to test 60.01-59.94. The overall characterization is: short-term trend upward, momentum slowing down, key level game.
Market sentiment observation:
From the perspective of group psychology and reflexivity, the API's "further inventory buildup" provided a basis for a bearish narrative, but the destocking of refined oil products and geopolitical disturbances created a complex sentiment of "good structure within bad news." This is reflected in the market as follows:
The swings between fear and greed are converging – there is an increase in sideways trading between 60.40 and 60.77, and liquidity is concentrated near key price levels;
Volatility has declined marginally but remains highly sensitive to news – prior to the EIA report, the market is reluctant to price in significantly in advance and instead uses options hedging and spread strategies to reduce net directional exposure.
Improved crack spreads have led to a coexistence of "structural bullishness" and "overall bearishness," resulting in a high probability of the continuation of the consolidation market.
Therefore, the current market consensus can be summarized as: remaining cautious about inventory accumulation and maintaining flexibility in expectations regarding geopolitics and the refined oil supply chain. Such consensus often leads to rapid repricing after the actual EIA data is released, resulting in a significant increase in the frequency of short-term false breakouts and pullbacks for confirmation.
Market Outlook:
Short-term scenario (with EIA as the dividing line)
The likely path for a rebound: If the EIA report does not replicate a significant increase in inventory, or if there is a slight increase or unexpected decrease in inventory, coupled with continued geopolitical disturbances, the probability of a return of momentum above 60.77 increases, and the price may retest 61.00 and challenge 61.09; if it breaks through effectively and completes a pullback confirmation, the short-term trend may enter a breakout-consolidation-breakout rhythm, and volatility may expand again.
A potential downward path: If the EIA confirms significant inventory accumulation and geopolitical tensions ease, it will be difficult to hold above 60.77. A break below 60.40 and the trendline would trigger a technical downtrend, targeting 60.01. Further attention should be paid to the support strength and probability of a false break below the previous low of 59.94. In this scenario, a weakening MACD above the zero line and an RSI falling below 50 would be simultaneous signals of a shift in momentum.
Mid-term perspective (several weeks)
Inventory cycles, refinery maintenance schedules, and geopolitical variables collectively determine the upper and lower limits of the trading range. If inventories continue to accumulate while refined product inventory reduction slows marginally, bullish market sentiment will struggle to develop, and oil prices are likely to form resistance near the previous high of $61.09, reverting to mean reversion within the trading range. Conversely, if inventories shift from accumulation to decline, coupled with supply disruptions, the $60 level will gradually evolve into a support zone, and the upper resistance level is expected to be broken through by increased trading volume.
Conclusion
With inventory accumulation and geopolitical disturbances offsetting each other, the 60.40-60.77 range forms a short-term "price magnet." If the EIA report fails to further disprove the rebound logic, prices are likely to test 61.00/61.09 for a breakout confirmation. If inventory accumulation exceeds expectations or geopolitical tensions ease marginally, the trend line at 60.40 will be tested, and a break below this level increases the probability of a pullback to 60.01-59.94. For professional traders, the current phase is more like waiting for a "confirmation signal": the validity of the price level and the sustainability of the momentum will determine whether the next move is a trend extension or a mean reversion.
- Risk Warning and Disclaimer
- The market involves risk, and trading may not be suitable for all investors. This article is for reference only and does not constitute personal investment advice, nor does it take into account certain users’ specific investment objectives, financial situation, or other needs. Any investment decisions made based on this information are at your own risk.