The history of gold development serves as a warning: every moment of glory is accompanied by the test of objective data.
2025-11-06 18:01:44
On Thursday (November 6), spot gold continued its rebound from yesterday during the Asian and European sessions, currently up 0.85% and trading around $4,012. Among the popular safe-haven assets in the market, the US dollar, US Treasury bonds, and gold are all advancing in tandem. Recently, the US dollar and US Treasury bonds have performed exceptionally well, and today they have begun to adjust, allowing gold to take the opportunity to rebound.
The narrative of an AI bubble in the United States, government shutdowns, and geopolitical issues continue to support buying of safe-haven assets. This article quotes recent remarks from AJ Bell Investment Director to provide readers with some historical observations on gold.
According to Lars Molde, Chief Investment Officer at AJ Bell, gold is currently in its third major bull market since 1971. While the first two bull cycles saw deep pullbacks, government debt, geopolitical factors, the dollar's performance, and inflation are likely to continue driving gold prices higher in this cycle.
The first bull market that Molde refers to began when President Nixon abandoned the gold standard and dismantled the Bretton Woods monetary system. He points out that "as the Nixon administration began to expand the U.S. federal deficit, inflation soared, and coupled with the impact of two oil price shocks, the price of gold rose from $35 per ounce in August 1971 to a peak of $835 per ounce in January 1980."
Although gold investors are able to avoid the impact of severe inflation, the investment process is not always smooth sailing.
Even during the glorious bull market of the 1970s, there were no fewer than three minor bear markets – one in 1973, one in 1974, and one that lasted for more than 18 months from January 1975 to the summer of 1976, during which gold prices fell by more than 20%.
To further test the resilience of the bulls, gold experienced five 10%-20% pullbacks, occurring in 1972, 1973, 1977, 1978, and 1979.
Molde stated that although the last two pullbacks lasted only a month, "these pullbacks still tested the resolve of gold bulls, even against the backdrop of a near-vertical rise in gold prices during the final sprint of the bull market."
"Subsequently, gold entered a period of dormancy as the Federal Reserve under Paul Volcker and the Thatcher government in the UK worked hard to curb inflation—with deregulation on both sides of the Atlantic, the restoration of peace in the Middle East, and declining oil prices all playing a supporting role," he wrote. "Double-digit interest rates also made the opportunity cost of holding gold prohibitively high."
But Molde noted that after gold prices bottomed out and stabilized above $250 an ounce in 2001, they attracted "a new generation of investors who sought refuge from ultra-loose monetary policies following the bursting of the tech, media, and telecommunications bubbles of 2001-2003 and the global financial crisis of 2007-2009." "Faced with zero interest rate policies (ZIRP), quantitative easing (QE), and balance sheet expansion, the market began chasing value stores or safe-haven assets, with some investors viewing gold as an ideal target."
“Even in this second round of upward movement, gold still tried its best to test the resolve of believers, with two bear markets in 2006 and 2008, and a correction of more than 10% in 2003, 2004, 2006, 2009 and 2010 respectively,” he pointed out.
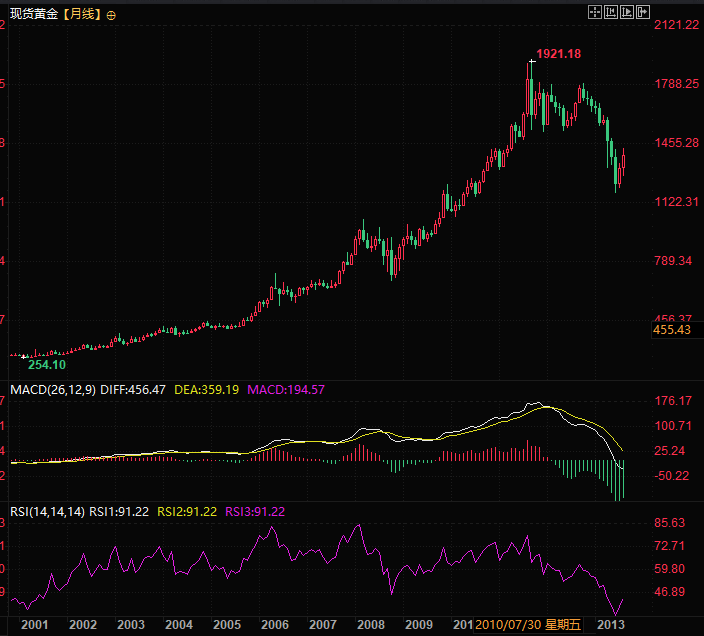
In 2011, gold prices peaked at nearly $1,900 per ounce, before falling to around $1,000 per ounce in 2015. The core reason was the return of central banks to market control after the global financial crisis. "Mario Draghi's 2012 pledge to 'maintain the stability of the Eurozone at all costs' was also seen as a warning sign. The low-growth, low-inflation environment led many to believe that the market had calmed down and that gold's safe-haven function was no longer needed, especially after the EU debt crisis seemed to have subsided," he said.
(US Dollar Index Daily Chart 2001-2011)
But Molde points out that gold began to rise quietly after 2015, "long before the COVID-19 pandemic, lockdowns, and massive government fiscal support, not to mention tariffs and trade wars, new unrest in the Middle East, and the outbreak of conflict in Eastern Europe." "Perhaps the signal that gold is sending is that central banks will find it difficult (if not impossible) to get rid of zero-interest-rate policies and quantitative easing, and their balance sheets will continue to expand—the Fed's move to pause quantitative tightening (QT) this fall precisely confirms that this view is still relevant today."
He pointed out that this third bull market, which lasted for many years, also saw bear market phases and significant corrections.
"In 2022, as the world recovered from lockdowns, gold prices plummeted by more than 20%, catching some bulls off guard; while the pullbacks of more than 10% that occurred every year in 2016, 2018, 2020, 2021 and 2023 indicate that volatility has never left the market."
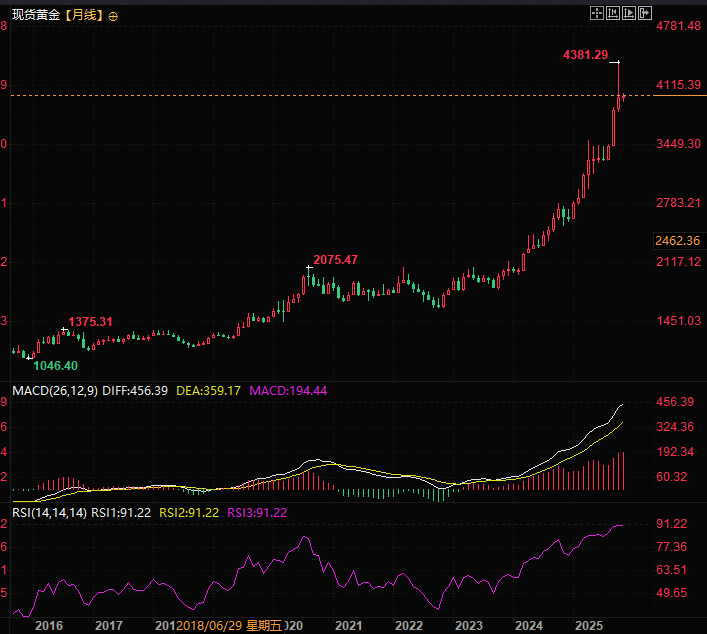
(Spot gold weekly chart 2015-2025)
“Over the past 12 months, gold has risen by 45% in dollar terms, a surge that dwarfs the Nikkei 225, Nasdaq Composite, and Hang Seng Tech indices, raising questions about how high gold prices can climb before showing signs of a bubble,” he wrote in a recent analysis report.
"Those skeptics who still view gold as a barbaric relic, a useless metal with no returns, or even believe that the cost of holding gold is as high as 4% (due to the loss of cash interest income), may secretly agree as gold prices fall from last month's record high, but this round of correction does not necessarily mean the end of the rally."
During the bull markets of 1971-1980 and 2001-2010, there were multiple pullbacks, but these pullbacks ultimately did not reverse or hinder the significant rise in gold prices.
However, it is worth noting that history cannot represent the future, and the so-called long-term trend may be 5 years or 10 years.
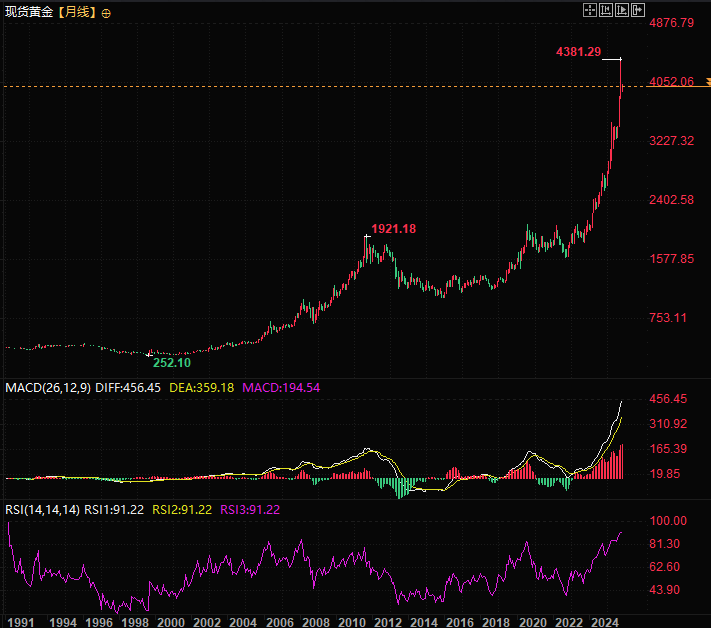
(Spot gold daily chart, 1991-2025, source: EasyForex)
Molde stated that all of this is closely related to the current upward trend and the current economic and financial challenges.
"The surge in government debt and interest payments has led gold bulls to believe that zero interest rate policies and quantitative easing may be reintroduced into the policy toolbox of central banks around the world, especially since some central banks now seem less willing to hold US Treasury bonds and dollar assets as they have in the past, due to political, economic, or financial considerations," he wrote.
"If rising debt, sticky inflation, geopolitical conflicts, and political and fiscal policy pressures on central banks and monetary authorities have all played a role in this round of gold price increases, then it is reasonable to assume that investors will wait until at least some of these risks have subsided before moving away from gold again—although that day will come sooner or later."
Molde stated, "At the same time, a potential indicator of whether gold is nearing the peak of this cycle is its affordability." "One way to judge this is to observe how much gold an average household could buy if they spent their entire annual income. If the price of gold is beyond the reach of ordinary workers (and even ordinary investors), it will at least dampen some of the incremental buying."
He pointed out that "before President Nixon abandoned the gold standard and dismantled the Bretton Woods monetary system in August 1971, an ounce of gold was equivalent to less than 1% of the average American family's annual disposable income."
"At the end of the great gold bull market in the 1970s, this ratio peaked at over 9% in the late 1980s."
"From this perspective, the current ratio of nearly 6.5% suggests that gold prices may still have room to rise, especially if inflation begins to pick up and drives income growth through wage increases or asset price increases."
However, as the chart shows, the growth rate of gold prices has surpassed the growth rate of disposable income for the first time, and has exhibited a steep acceleration, which is also unprecedented in history. This is something that deserves serious attention.
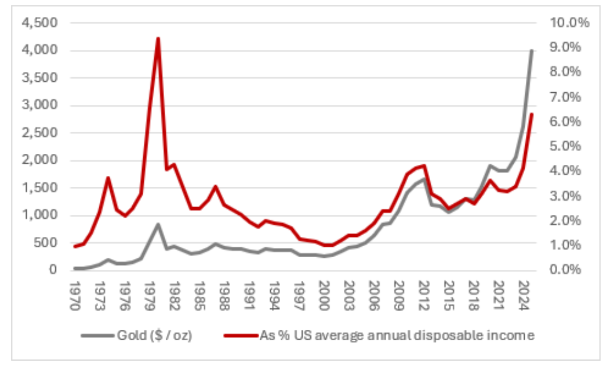
(Overlay chart of gold price and US disposable income)
The narrative of an AI bubble in the United States, government shutdowns, and geopolitical issues continue to support buying of safe-haven assets. This article quotes recent remarks from AJ Bell Investment Director to provide readers with some historical observations on gold.
According to Lars Molde, Chief Investment Officer at AJ Bell, gold is currently in its third major bull market since 1971. While the first two bull cycles saw deep pullbacks, government debt, geopolitical factors, the dollar's performance, and inflation are likely to continue driving gold prices higher in this cycle.
The first bull market (1971-1980): driven by the collapse of the gold standard and inflation, with highs amidst volatility.
The first bull market that Molde refers to began when President Nixon abandoned the gold standard and dismantled the Bretton Woods monetary system. He points out that "as the Nixon administration began to expand the U.S. federal deficit, inflation soared, and coupled with the impact of two oil price shocks, the price of gold rose from $35 per ounce in August 1971 to a peak of $835 per ounce in January 1980."
Although gold investors are able to avoid the impact of severe inflation, the investment process is not always smooth sailing.
Even during the glorious bull market of the 1970s, there were no fewer than three minor bear markets – one in 1973, one in 1974, and one that lasted for more than 18 months from January 1975 to the summer of 1976, during which gold prices fell by more than 20%.
To further test the resilience of the bulls, gold experienced five 10%-20% pullbacks, occurring in 1972, 1973, 1977, 1978, and 1979.
Molde stated that although the last two pullbacks lasted only a month, "these pullbacks still tested the resolve of gold bulls, even against the backdrop of a near-vertical rise in gold prices during the final sprint of the bull market."
"Subsequently, gold entered a period of dormancy as the Federal Reserve under Paul Volcker and the Thatcher government in the UK worked hard to curb inflation—with deregulation on both sides of the Atlantic, the restoration of peace in the Middle East, and declining oil prices all playing a supporting role," he wrote. "Double-digit interest rates also made the opportunity cost of holding gold prohibitively high."
The second bull market (2001-2011): Loose monetary policy + safe-haven demand, followed by a period of fluctuation and a market peak.
But Molde noted that after gold prices bottomed out and stabilized above $250 an ounce in 2001, they attracted "a new generation of investors who sought refuge from ultra-loose monetary policies following the bursting of the tech, media, and telecommunications bubbles of 2001-2003 and the global financial crisis of 2007-2009." "Faced with zero interest rate policies (ZIRP), quantitative easing (QE), and balance sheet expansion, the market began chasing value stores or safe-haven assets, with some investors viewing gold as an ideal target."
“Even in this second round of upward movement, gold still tried its best to test the resolve of believers, with two bear markets in 2006 and 2008, and a correction of more than 10% in 2003, 2004, 2006, 2009 and 2010 respectively,” he pointed out.
In 2011, gold prices peaked at nearly $1,900 per ounce, before falling to around $1,000 per ounce in 2015. The core reason was the return of central banks to market control after the global financial crisis. "Mario Draghi's 2012 pledge to 'maintain the stability of the Eurozone at all costs' was also seen as a warning sign. The low-growth, low-inflation environment led many to believe that the market had calmed down and that gold's safe-haven function was no longer needed, especially after the EU debt crisis seemed to have subsided," he said.
(US Dollar Index Daily Chart 2001-2011)
The third bull market (2015 to present): Early start + continued volatility, supporting factors remain unchanged.
But Molde points out that gold began to rise quietly after 2015, "long before the COVID-19 pandemic, lockdowns, and massive government fiscal support, not to mention tariffs and trade wars, new unrest in the Middle East, and the outbreak of conflict in Eastern Europe." "Perhaps the signal that gold is sending is that central banks will find it difficult (if not impossible) to get rid of zero-interest-rate policies and quantitative easing, and their balance sheets will continue to expand—the Fed's move to pause quantitative tightening (QT) this fall precisely confirms that this view is still relevant today."
He pointed out that this third bull market, which lasted for many years, also saw bear market phases and significant corrections.
"In 2022, as the world recovered from lockdowns, gold prices plummeted by more than 20%, catching some bulls off guard; while the pullbacks of more than 10% that occurred every year in 2016, 2018, 2020, 2021 and 2023 indicate that volatility has never left the market."
(Spot gold weekly chart 2015-2025)
Gold prices have seen impressive annual gains, and pullbacks do not alter the long-term trend.
“Over the past 12 months, gold has risen by 45% in dollar terms, a surge that dwarfs the Nikkei 225, Nasdaq Composite, and Hang Seng Tech indices, raising questions about how high gold prices can climb before showing signs of a bubble,” he wrote in a recent analysis report.
"Those skeptics who still view gold as a barbaric relic, a useless metal with no returns, or even believe that the cost of holding gold is as high as 4% (due to the loss of cash interest income), may secretly agree as gold prices fall from last month's record high, but this round of correction does not necessarily mean the end of the rally."
During the bull markets of 1971-1980 and 2001-2010, there were multiple pullbacks, but these pullbacks ultimately did not reverse or hinder the significant rise in gold prices.
However, it is worth noting that history cannot represent the future, and the so-called long-term trend may be 5 years or 10 years.
(Spot gold daily chart, 1991-2025, source: EasyForex)
Current key drivers: a convergence of debt, inflation, and geopolitical risks.
Molde stated that all of this is closely related to the current upward trend and the current economic and financial challenges.
"The surge in government debt and interest payments has led gold bulls to believe that zero interest rate policies and quantitative easing may be reintroduced into the policy toolbox of central banks around the world, especially since some central banks now seem less willing to hold US Treasury bonds and dollar assets as they have in the past, due to political, economic, or financial considerations," he wrote.
"If rising debt, sticky inflation, geopolitical conflicts, and political and fiscal policy pressures on central banks and monetary authorities have all played a role in this round of gold price increases, then it is reasonable to assume that investors will wait until at least some of these risks have subsided before moving away from gold again—although that day will come sooner or later."
Peak indicator: Gold affordability threshold
Molde stated, "At the same time, a potential indicator of whether gold is nearing the peak of this cycle is its affordability." "One way to judge this is to observe how much gold an average household could buy if they spent their entire annual income. If the price of gold is beyond the reach of ordinary workers (and even ordinary investors), it will at least dampen some of the incremental buying."
He pointed out that "before President Nixon abandoned the gold standard and dismantled the Bretton Woods monetary system in August 1971, an ounce of gold was equivalent to less than 1% of the average American family's annual disposable income."
"At the end of the great gold bull market in the 1970s, this ratio peaked at over 9% in the late 1980s."
"From this perspective, the current ratio of nearly 6.5% suggests that gold prices may still have room to rise, especially if inflation begins to pick up and drives income growth through wage increases or asset price increases."
However, as the chart shows, the growth rate of gold prices has surpassed the growth rate of disposable income for the first time, and has exhibited a steep acceleration, which is also unprecedented in history. This is something that deserves serious attention.
(Overlay chart of gold price and US disposable income)
- Risk Warning and Disclaimer
- The market involves risk, and trading may not be suitable for all investors. This article is for reference only and does not constitute personal investment advice, nor does it take into account certain users’ specific investment objectives, financial situation, or other needs. Any investment decisions made based on this information are at your own risk.