Is the "golden age" just beginning? Institutions are betting big above $5,000, while retail investors are already selling at a loss at low prices.
2025-11-06 21:35:16
On Thursday (November 6), spot gold fluctuated slightly above $4,000 per ounce during the North American session. On the four-hour chart, the price has approached the previous downtrend line again, and the short-term rebound continues but has not yet been confirmed as a breakout.
The recent pullback is primarily technical rather than driven by weakening fundamentals. After surging in mid-October, the market accumulated substantial unrealized profits in a short period. Profit-taking, coupled with a "momentum cooling" effect from quantitative models, triggered a pullback. Simultaneously, the US dollar index rose, and real interest rates stabilized in the short term, increasing the cost of holding gold. Furthermore, several Federal Reserve officials signaled a "longer and higher" stance, suppressing immediate preference for non-interest-bearing assets.
However, structural demand and safe-haven attributes have not weakened. Several international investment banks have repeatedly reiterated their bullish stance in the medium to long term this year, with target ranges concentrated between $4200 and $5600 per ounce. Their logic boils down to three points: First, the gap between global nominal interest rates and inflation is narrowing, making it difficult for the central level of real interest rates to rise; second, fiscal deficits and sovereign debt supply expansion are increasing term premiums, strengthening market demand for "high-duration, low-correlation" assets; third, geopolitical uncertainties are unlikely to dissipate quickly, making gold's role as a "risk hedge and liquidity container" even more attractive.
Demand data corroborates this: global gold demand reached 1,313 tons in the third quarter of 2025, a new quarterly high; gold ETFs added 222 tons of holdings during the quarter, amounting to approximately $24 billion; and ETFs saw a total inflow of 619 tons this year, amounting to approximately $64 billion, with about 346 tons in North America and 148 tons in Europe. During the same period, demand for gold bars and coins was 316 tons, and while jewelry demand decreased by 19% year-on-year, its value still increased by 13% to $41 billion due to rising prices. This structure shows that after the price surge, both "cooling of trading activity" and "resilience in asset allocation" coexist, indicating that the fundamental macroeconomic logic of gold remains intact.
The four-hour candlestick chart shows that after falling from the stage high of $4138.52, the price moved along a clear downward trend line. During this period, there was a rebound high near $4046.13, but it failed to hold. Subsequently, a higher low was formed at $3928.80, which together with the earlier low of $3886.51 formed the prototype of a "rising double bottom".
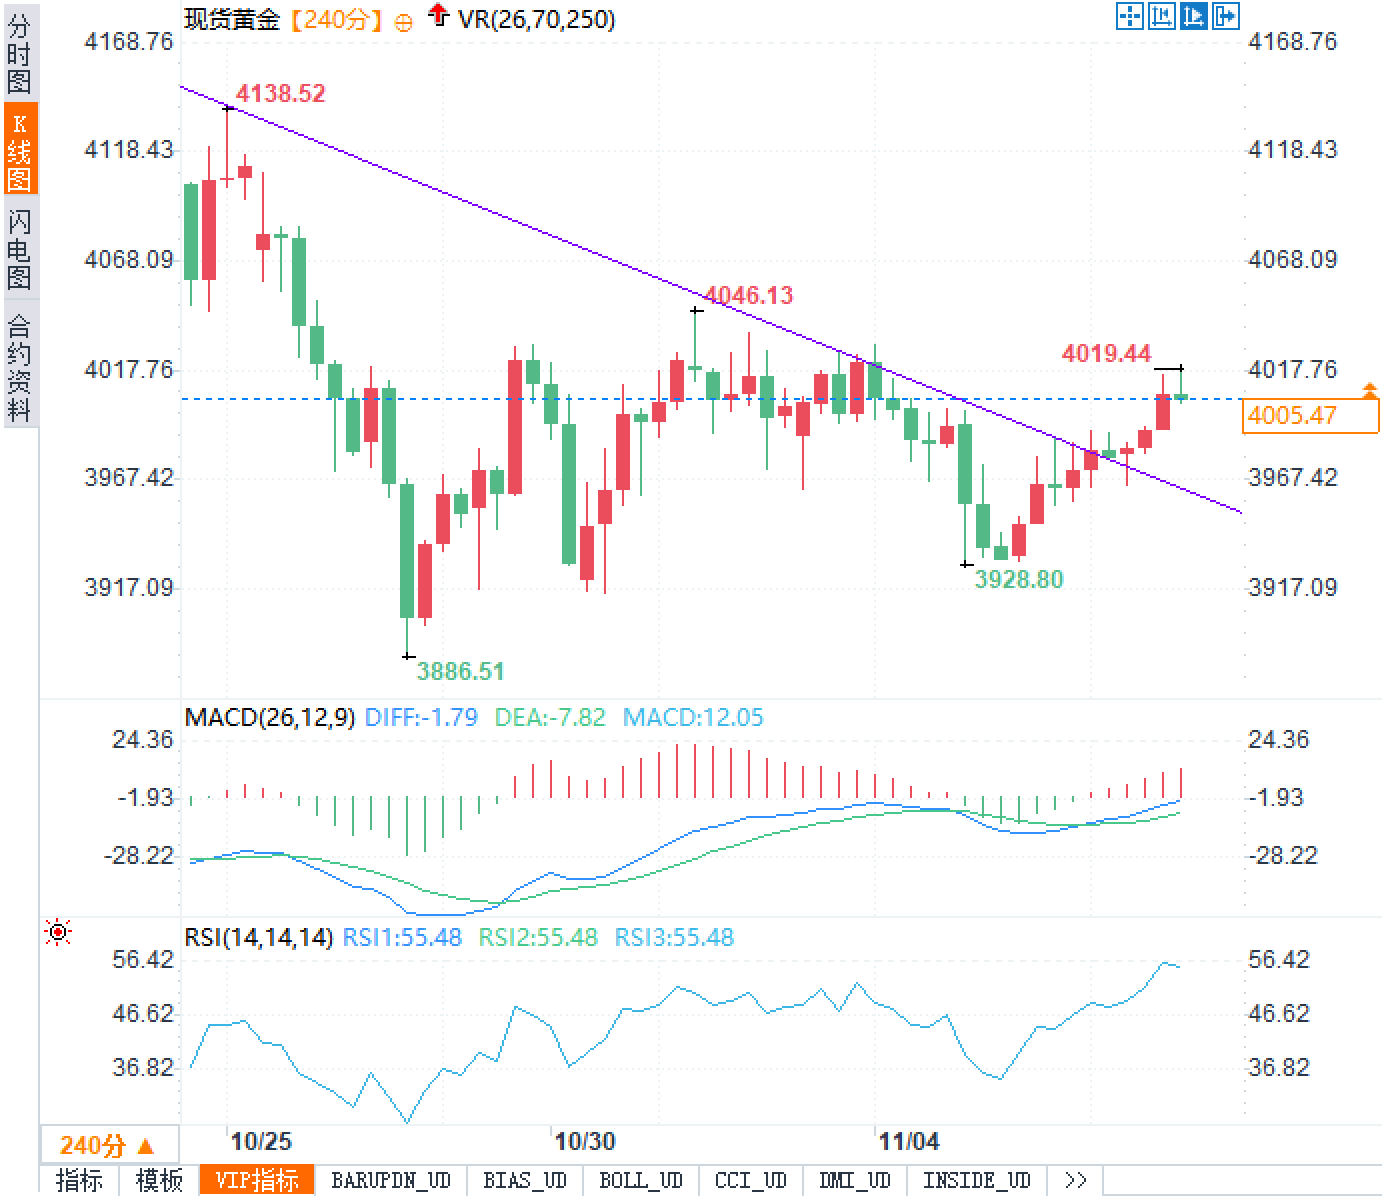
In terms of momentum, the MACD (26,12,9) has formed a golden cross below the zero axis, and the DIFF has risen from a low level to approach the DEA. The histogram shows an expansion of red bars (MACD in the figure: 12.05 is positive), indicating that the bearish momentum is weakening and the bullish momentum is replenishing. However, it has not yet completed the crossing of the zero axis, and the trend reversal is still in the incubation stage. The Relative Strength Index (RSI) (14) has risen to around 55, returning to above the central pivot but still far from the traditional overbought threshold, indicating that the "technical rebound has not been overdrawn". The core information given by the price and volume structure and the resonance of indicators is that the trend has shifted from a one-sided downward trend to a rhythm switching period of "downward deceleration - horizontal consolidation - upward attempt".
Key price levels: Resistance levels to watch are 4019.44 (recent high), 4046.13 (previous high plus trendline resistance), the densely traded area between 4080 and 4100, and the previous high of 4138.52. Support levels are the breakout and retracement zone between 3990 and 3980, the consolidation zone around 3967, and further down are the structural lows of 3928.80 and 3886.51. If the price stabilizes above 4046.13 with three or more consecutive four-hour bullish candles, accompanied by the MACD crossing above the zero line, then a valid breakout of the downtrend line can be confirmed. If the price falls back to 3967 with increased volume, the rebound will be interrupted, and the market will return to its range-bound trading pattern.
The rapid surge in mid-October created a significant "profit anchoring," and in the following weeks, sentiment shifted from "chasing the rally" to "drawdown identification." ETFs experienced net redemptions in the short term, which is a normal mean reversion to the previous record inflows; risk aversion did not collapse, but rather shifted from "immediate hedging" to "buying on dips." Futures positions underwent a second deleveraging during the momentum decay phase, reducing volatility but simultaneously preserving the "powder" for a subsequent volume breakout.
Short-term scenario:
(1) Strong Performance: If the price breaks through 4046.13 with increased volume and completes the pullback without breaking it, the RSI will rise to 60-65, and the MACD will cross the zero line and maintain a red bar. The target will be 4080-4100, and further test 4138.52. This path means a level switch of "downtrend line - resistance to support", and the market will transition from "rebound" to "tentative trend reversal".
(2) Continued oscillation: If the price fluctuates repeatedly in the 4010-4040 range without a significant increase in volume, the market will digest the previous decline in a horizontal channel manner, with the focus on the 3990-3980 and 4040-4050 ranges. Time will be used to create space, and the market will wait for macro catalysts (such as interest rate guidance or geopolitical risks) before choosing a direction.
(3) Weak pullback: If the price falls below 3967 and closes with a long bearish candlestick, while the MACD red bars shorten and the RSI falls below 50, the price will retest 3928.80, and if it breaks down further, it will look towards 3886.51. This path belongs to "double bottoming after a failed rebound", but as long as it does not break through 3886.51, it is still within the category of "deceleration of the decline".
Medium- to long-term perspective:
Under the triple framework of "real interest rate ceiling - geopolitical premium - asset allocation diversification", the medium- to long-term bullish structure remains intact. Multiple international institutions have set their 2025-2026 targets in the $4,000-$5,600 range: some institutions predict an upside scenario of $5,055 in 2026, others provide a benchmark around $5,000, and still others believe the average from Q4 2025 to Q1 2026 will be $4,000-$4,200. If stronger geopolitical uncertainty emerges or major central banks simultaneously shift to easing, gold has the potential to challenge the $5,000-$5,600 Fibonacci extension range. Conversely, if real interest rates rise significantly again and the dollar remains strong, gold may consolidate at high levels or even decline, but its attractiveness for allocation around $3,800-$3,900 will significantly increase.
Conclusion:
In the short term, the market remains in a pivotal zone of "shifting from weakness to stability," with the direction depending on how the downtrend line is handled. The medium- to long-term bullish logic remains intact, and structural and allocation-related demand will provide implicit support during pullbacks. A move above 4046.13 targets 4080-4100 and 4138.52; a break below 3967 would lead back to the bottom of the trading range at 3928.80 and 3886.51.
Fundamentals: Technical correction dominates, structural demand remains strong
The recent pullback is primarily technical rather than driven by weakening fundamentals. After surging in mid-October, the market accumulated substantial unrealized profits in a short period. Profit-taking, coupled with a "momentum cooling" effect from quantitative models, triggered a pullback. Simultaneously, the US dollar index rose, and real interest rates stabilized in the short term, increasing the cost of holding gold. Furthermore, several Federal Reserve officials signaled a "longer and higher" stance, suppressing immediate preference for non-interest-bearing assets.
However, structural demand and safe-haven attributes have not weakened. Several international investment banks have repeatedly reiterated their bullish stance in the medium to long term this year, with target ranges concentrated between $4200 and $5600 per ounce. Their logic boils down to three points: First, the gap between global nominal interest rates and inflation is narrowing, making it difficult for the central level of real interest rates to rise; second, fiscal deficits and sovereign debt supply expansion are increasing term premiums, strengthening market demand for "high-duration, low-correlation" assets; third, geopolitical uncertainties are unlikely to dissipate quickly, making gold's role as a "risk hedge and liquidity container" even more attractive.
Demand data corroborates this: global gold demand reached 1,313 tons in the third quarter of 2025, a new quarterly high; gold ETFs added 222 tons of holdings during the quarter, amounting to approximately $24 billion; and ETFs saw a total inflow of 619 tons this year, amounting to approximately $64 billion, with about 346 tons in North America and 148 tons in Europe. During the same period, demand for gold bars and coins was 316 tons, and while jewelry demand decreased by 19% year-on-year, its value still increased by 13% to $41 billion due to rising prices. This structure shows that after the price surge, both "cooling of trading activity" and "resilience in asset allocation" coexist, indicating that the fundamental macroeconomic logic of gold remains intact.
Technical aspects:
The four-hour candlestick chart shows that after falling from the stage high of $4138.52, the price moved along a clear downward trend line. During this period, there was a rebound high near $4046.13, but it failed to hold. Subsequently, a higher low was formed at $3928.80, which together with the earlier low of $3886.51 formed the prototype of a "rising double bottom".
In terms of momentum, the MACD (26,12,9) has formed a golden cross below the zero axis, and the DIFF has risen from a low level to approach the DEA. The histogram shows an expansion of red bars (MACD in the figure: 12.05 is positive), indicating that the bearish momentum is weakening and the bullish momentum is replenishing. However, it has not yet completed the crossing of the zero axis, and the trend reversal is still in the incubation stage. The Relative Strength Index (RSI) (14) has risen to around 55, returning to above the central pivot but still far from the traditional overbought threshold, indicating that the "technical rebound has not been overdrawn". The core information given by the price and volume structure and the resonance of indicators is that the trend has shifted from a one-sided downward trend to a rhythm switching period of "downward deceleration - horizontal consolidation - upward attempt".
Key price levels: Resistance levels to watch are 4019.44 (recent high), 4046.13 (previous high plus trendline resistance), the densely traded area between 4080 and 4100, and the previous high of 4138.52. Support levels are the breakout and retracement zone between 3990 and 3980, the consolidation zone around 3967, and further down are the structural lows of 3928.80 and 3886.51. If the price stabilizes above 4046.13 with three or more consecutive four-hour bullish candles, accompanied by the MACD crossing above the zero line, then a valid breakout of the downtrend line can be confirmed. If the price falls back to 3967 with increased volume, the rebound will be interrupted, and the market will return to its range-bound trading pattern.
Market sentiment observation:
The rapid surge in mid-October created a significant "profit anchoring," and in the following weeks, sentiment shifted from "chasing the rally" to "drawdown identification." ETFs experienced net redemptions in the short term, which is a normal mean reversion to the previous record inflows; risk aversion did not collapse, but rather shifted from "immediate hedging" to "buying on dips." Futures positions underwent a second deleveraging during the momentum decay phase, reducing volatility but simultaneously preserving the "powder" for a subsequent volume breakout.
Market Outlook:
Short-term scenario:
(1) Strong Performance: If the price breaks through 4046.13 with increased volume and completes the pullback without breaking it, the RSI will rise to 60-65, and the MACD will cross the zero line and maintain a red bar. The target will be 4080-4100, and further test 4138.52. This path means a level switch of "downtrend line - resistance to support", and the market will transition from "rebound" to "tentative trend reversal".
(2) Continued oscillation: If the price fluctuates repeatedly in the 4010-4040 range without a significant increase in volume, the market will digest the previous decline in a horizontal channel manner, with the focus on the 3990-3980 and 4040-4050 ranges. Time will be used to create space, and the market will wait for macro catalysts (such as interest rate guidance or geopolitical risks) before choosing a direction.
(3) Weak pullback: If the price falls below 3967 and closes with a long bearish candlestick, while the MACD red bars shorten and the RSI falls below 50, the price will retest 3928.80, and if it breaks down further, it will look towards 3886.51. This path belongs to "double bottoming after a failed rebound", but as long as it does not break through 3886.51, it is still within the category of "deceleration of the decline".
Medium- to long-term perspective:
Under the triple framework of "real interest rate ceiling - geopolitical premium - asset allocation diversification", the medium- to long-term bullish structure remains intact. Multiple international institutions have set their 2025-2026 targets in the $4,000-$5,600 range: some institutions predict an upside scenario of $5,055 in 2026, others provide a benchmark around $5,000, and still others believe the average from Q4 2025 to Q1 2026 will be $4,000-$4,200. If stronger geopolitical uncertainty emerges or major central banks simultaneously shift to easing, gold has the potential to challenge the $5,000-$5,600 Fibonacci extension range. Conversely, if real interest rates rise significantly again and the dollar remains strong, gold may consolidate at high levels or even decline, but its attractiveness for allocation around $3,800-$3,900 will significantly increase.
Conclusion:
In the short term, the market remains in a pivotal zone of "shifting from weakness to stability," with the direction depending on how the downtrend line is handled. The medium- to long-term bullish logic remains intact, and structural and allocation-related demand will provide implicit support during pullbacks. A move above 4046.13 targets 4080-4100 and 4138.52; a break below 3967 would lead back to the bottom of the trading range at 3928.80 and 3886.51.
- Risk Warning and Disclaimer
- The market involves risk, and trading may not be suitable for all investors. This article is for reference only and does not constitute personal investment advice, nor does it take into account certain users’ specific investment objectives, financial situation, or other needs. Any investment decisions made based on this information are at your own risk.