Interpreting the World Gold Council's Q3 Report: Gold Price Trends Amidst Diverging Demand
2025-11-07 17:09:01
First and foremost, it is clear from the report that the largest participants in gold trading are central banks, gold jewelry consumers, and gold ETFs.
This article uses data from the World Gold Council's third-quarter report to summarize the characteristics of this three-way transaction and makes a simple prediction of gold prices.
Global gold demand (including over-the-counter investment) is projected to grow by 3% year-on-year to 1,313 tons in the third quarter of 2025, the highest quarterly demand since the World Gold Council began collecting such statistics.
However, this demand pales in comparison to the total value of gold transactions in the quarter, which surged 44% year-on-year to a record high of $146 billion.
By the end of the third quarter of 2025, total gold demand is projected to increase by 1% to 3,717 tons, corresponding to a value of US$384 billion, representing a year-on-year increase of 41%.
It is worth noting that total demand increased by 3%, but transaction value increased by 41%, which is somewhat of a divergence between volume and price. That is, the 3% increase in demand pushed up the overall gold price by more than 40%, while the supply did not increase significantly due to the rigidity of gold production.
In the third quarter, investment demand continued to dominate gold demand.
Global gold ETF holdings increased significantly (+222 tons), coupled with the demand for gold bars and coins exceeding 300 tons for the fourth consecutive quarter (316 tons this quarter), which jointly drove the growth in total gold demand. However, ETFs are often not long-term investments, and after a rapid rise in gold prices, the eagerness to take profits may lead to a run on fund shares.
In the third quarter, global central bank gold purchases remained high at 220 tons, up 28% from the previous quarter. However, the cumulative gold purchases in the first three quarters of this year totaled 634 tons, a slowdown compared to 724 tons in the same period last year.
Gold jewelry consumption in the third quarter saw a double-digit year-on-year decline (a trend that has continued for the sixth consecutive quarter), falling to 371 tons, mainly due to historically high gold prices, which continued to put pressure on jewelry consumption. However, in stark contrast, the value of gold jewelry consumption increased by 13% year-on-year, reaching US$41 billion.
Gold demand for technology applications declined slightly compared to the third quarter of 2024. Although the application of artificial intelligence has helped to increase this part of gold demand, it is still subject to the dual headwinds of US tariff policies and soaring gold prices. However, since the total demand is relatively small, we will focus on the first three trading entities in our analysis of gold prices.
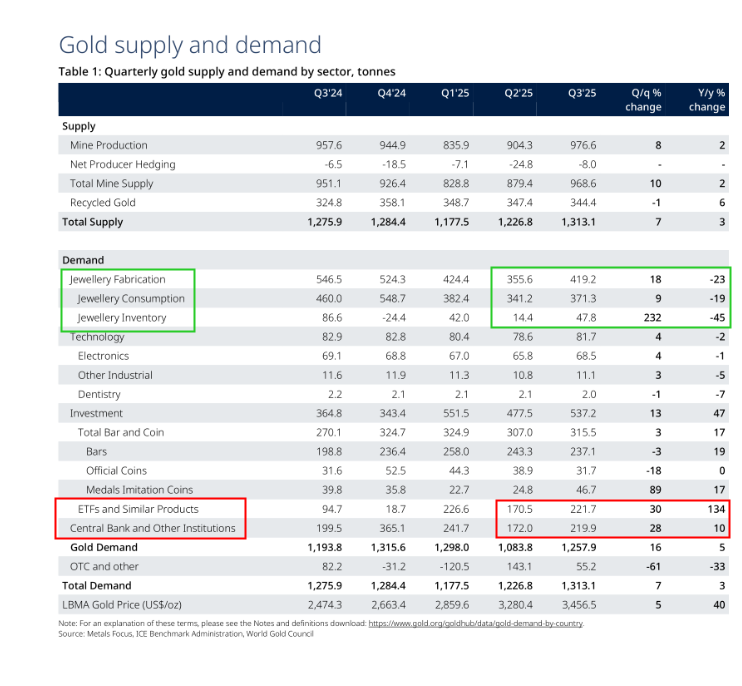
(Gold demand breakdown: The chart shows a decline in gold jewelry consumption, a slowdown in central bank gold purchases but still contributing the main increase in demand, and a surge in ETFs contributing to the increase in gold demand.)
As consumer goods, the demand for gold and silver jewelry is trending downwards, with the price of gold rising significantly in the past two years, which has greatly dampened the demand for gold jewelry.
"Consumer demand (including jewelry, gold bars, and gold coins) was 32 tons, a year-on-year decrease of 33%." "Gold and jewelry consumption continued the downward trend that began in the second quarter of 2022, declining by 12% year-on-year to 25 tons."
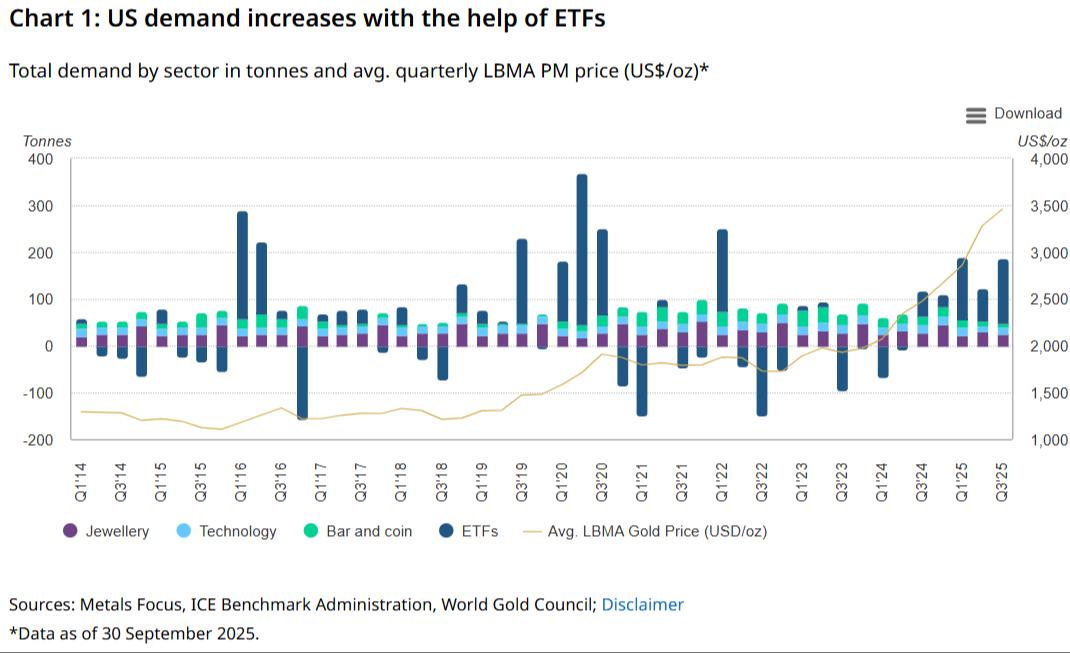
"Jewelry spending fell 12% quarter-over-quarter to $2.7 billion, but rose 23% year-over-year, marking the ninth consecutive quarter of positive year-over-year growth." Demand for gold bars and coins in the United States contracted sharply again this quarter, plummeting 64% year-over-year to 7 tons.
Analysts said, "This data refreshes the demand low point since the 2017-2019 trough before the COVID-19 pandemic, making the Americas the only major region to see a year-on-year decline in the third quarter." "In terms of value, demand was also weak, falling 49% year-on-year to $801 million."
"However, this data fails to reflect the true market picture: the weak performance this quarter stemmed from strong two-way trading activity, with a large amount of buying and profit-taking intertwined."
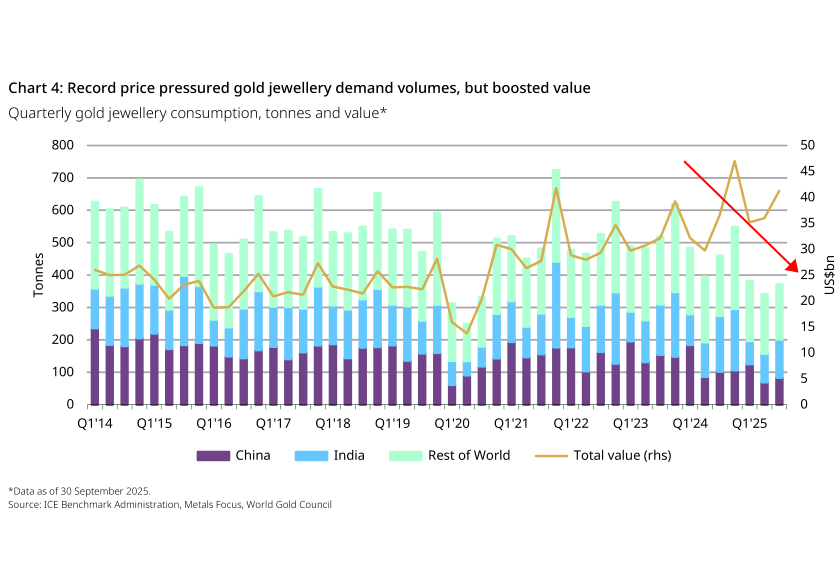
(Gold jewelry consumption trend chart; gold jewelry consumption is sensitive to price)
Demand for gold in the technology sector of the four core electronics manufacturing centers is showing a divergent trend. Analysts said: "Demand declined in the United States (down 16 tons, down 2% year-on-year) and Japan (down 19 tons, down 4% year-on-year); while demand remained stable in South Korea (up 7 tons, up 1% year-on-year) and mainland China and Hong Kong (up 21 tons, flat year-on-year)."
Meanwhile, ETFs once again dominated aggregate demand growth, with US-listed ETFs increasing their gold holdings by 137 tons in the third quarter, a year-on-year increase of 160%, bringing total holdings to 1,922 tons and assets under management (AUM) to $236 billion. The World Gold Council stated that gold ETFs were a key support this quarter, amid declining demand in other key sectors.
Analysts wrote, "Gold ETFs had a record performance in the third quarter, with net global inflows reaching $26 billion and total holdings increasing by 222 tons to 3,838 tons." "The contribution from the US market was particularly significant, accounting for 137 tons ($16 billion) of global demand, a staggering 62%." "This surge has profoundly reshaped the overall landscape of US gold demand."
"If we replace the ETF holdings increase in the third quarter with the 10-year average of 21 tons—even if we calculate based on the previous quarter's 70 tons—total demand this quarter would decrease by 44% or 4% respectively, instead of achieving a 50% quarter-on-quarter increase."
They added, "As of September, North American gold ETFs had seen a net inflow of $37 billion year-to-date—99% of which came from US-based funds—on track for their best annual performance ever, a milestone already confirmed by preliminary October data." Demand has also been strong in terms of tonnage, with North American funds now poised to rank among the top three performers this year.
(ETF holdings trend chart; ETF holdings have increased for three consecutive quarters)
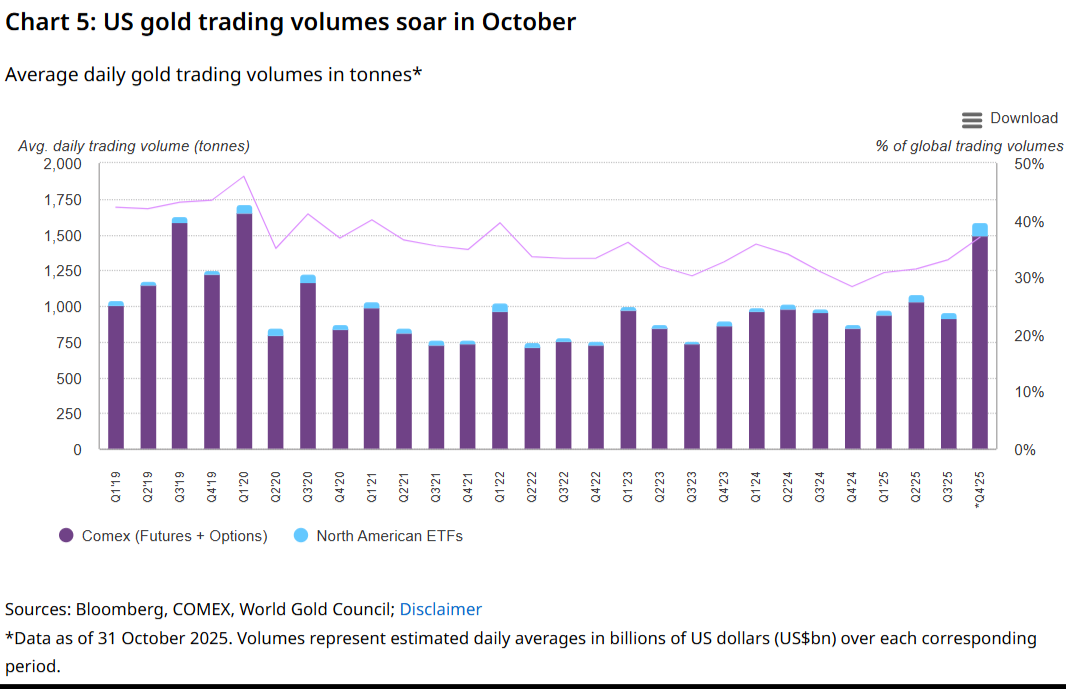
Analysts at the World Gold Council also provided an in-depth analysis of trading volume performance in the United States and other core markets. They noted: "In the third quarter, the average daily trading volume of futures and options on the New York Mercantile Exchange (COMEX) reached $104 billion (915 tons), a year-on-year increase of 35%; the average daily trading volume of North American ETFs (dominated by US funds) reached $5 billion (42 tons), a surge of 109% year-on-year." "The two combined contributed 33% of global market liquidity."
"Although U.S. trading volume declined month-on-month, this was mainly due to the sideways consolidation of gold prices in July and August, resulting in relatively sluggish trading activity." "Gold began its rebound in September, hitting 13 new historical highs, pushing U.S. trading volume to a record level of $138 billion (1,152 tons) per day, a 59% increase month-on-month, indicating a return of market momentum."
Analysts say this strong momentum continued into October, with gold prices hitting 11 more record highs, bringing the year-to-date total to 50. They stated, "The rebound was followed by an 8% pullback at the end of the month, exacerbating market volatility and driving a 51% month-over-month increase in U.S. trading volume, setting a new record of $208 billion (1587 tons) per day."
(Gold trading volume chart: both volume and price rose in the third quarter)
The median and average of gold price forecasts both fall around 3800, and the price of gold futures contracts has generally been higher than the forecasts of various institutions in years of statistical practice.
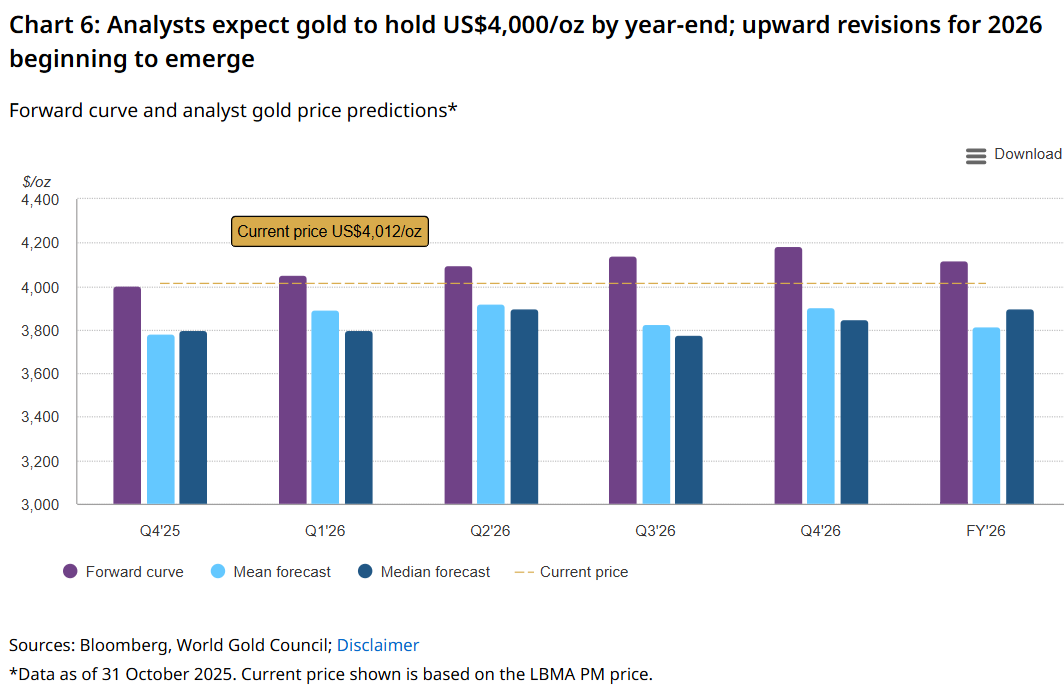
(Bar chart of institutional gold price forecasts)
Considering that overall demand for gold only increased by 3% while prices rose by more than 40%, this is a disguised divergence between volume and price, meaning that there was no significant increase in demand during the price increase.
Meanwhile, looking at the central bank, gold ETFs, and jewelry consumption, which are the largest demand drivers, central bank gold purchases are slowing down, and jewelry transaction demand is also slowing down significantly.
The rapid increase in holdings of gold ETFs in the third quarter highlights their trading nature, which may lead to the possibility of chasing highs and selling lows. This means that these funds are more susceptible to emotional factors and even technical aspects of the market.
In conclusion, geopolitical issues and the status of the US dollar as a reserve currency will be reflected in the behavior of the aforementioned gold buyers.
The fact that global gold demand has not increased significantly but prices have risen sharply casts a shadow over further price increases for gold.
However, if gold prices fall or the technical pattern is corrected, gold's consumer appeal or ETF buying could push prices up again. At the same time, the gold purchases by central banks around the world are also a key area to monitor.
This article uses data from the World Gold Council's third-quarter report to summarize the characteristics of this three-way transaction and makes a simple prediction of gold prices.
Global gold demand (including over-the-counter investment) is projected to grow by 3% year-on-year to 1,313 tons in the third quarter of 2025, the highest quarterly demand since the World Gold Council began collecting such statistics.
However, this demand pales in comparison to the total value of gold transactions in the quarter, which surged 44% year-on-year to a record high of $146 billion.
By the end of the third quarter of 2025, total gold demand is projected to increase by 1% to 3,717 tons, corresponding to a value of US$384 billion, representing a year-on-year increase of 41%.
It is worth noting that total demand increased by 3%, but transaction value increased by 41%, which is somewhat of a divergence between volume and price. That is, the 3% increase in demand pushed up the overall gold price by more than 40%, while the supply did not increase significantly due to the rigidity of gold production.
In the third quarter, investment demand continued to dominate gold demand.
Global gold ETF holdings increased significantly (+222 tons), coupled with the demand for gold bars and coins exceeding 300 tons for the fourth consecutive quarter (316 tons this quarter), which jointly drove the growth in total gold demand. However, ETFs are often not long-term investments, and after a rapid rise in gold prices, the eagerness to take profits may lead to a run on fund shares.
In the third quarter, global central bank gold purchases remained high at 220 tons, up 28% from the previous quarter. However, the cumulative gold purchases in the first three quarters of this year totaled 634 tons, a slowdown compared to 724 tons in the same period last year.
Gold jewelry consumption in the third quarter saw a double-digit year-on-year decline (a trend that has continued for the sixth consecutive quarter), falling to 371 tons, mainly due to historically high gold prices, which continued to put pressure on jewelry consumption. However, in stark contrast, the value of gold jewelry consumption increased by 13% year-on-year, reaching US$41 billion.
Gold demand for technology applications declined slightly compared to the third quarter of 2024. Although the application of artificial intelligence has helped to increase this part of gold demand, it is still subject to the dual headwinds of US tariff policies and soaring gold prices. However, since the total demand is relatively small, we will focus on the first three trading entities in our analysis of gold prices.
(Gold demand breakdown: The chart shows a decline in gold jewelry consumption, a slowdown in central bank gold purchases but still contributing the main increase in demand, and a surge in ETFs contributing to the increase in gold demand.)
Consumer demand is diverging: jewelry demand continues to decline, while demand for gold bars and coins hits a low.
As consumer goods, the demand for gold and silver jewelry is trending downwards, with the price of gold rising significantly in the past two years, which has greatly dampened the demand for gold jewelry.
"Consumer demand (including jewelry, gold bars, and gold coins) was 32 tons, a year-on-year decrease of 33%." "Gold and jewelry consumption continued the downward trend that began in the second quarter of 2022, declining by 12% year-on-year to 25 tons."
"Jewelry spending fell 12% quarter-over-quarter to $2.7 billion, but rose 23% year-over-year, marking the ninth consecutive quarter of positive year-over-year growth." Demand for gold bars and coins in the United States contracted sharply again this quarter, plummeting 64% year-over-year to 7 tons.
Analysts said, "This data refreshes the demand low point since the 2017-2019 trough before the COVID-19 pandemic, making the Americas the only major region to see a year-on-year decline in the third quarter." "In terms of value, demand was also weak, falling 49% year-on-year to $801 million."
"However, this data fails to reflect the true market picture: the weak performance this quarter stemmed from strong two-way trading activity, with a large amount of buying and profit-taking intertwined."
(Gold jewelry consumption trend chart; gold jewelry consumption is sensitive to price)
The use of funds in the technology sector is showing signs of divergence, but the total amount and incremental scale are relatively small.
Demand for gold in the technology sector of the four core electronics manufacturing centers is showing a divergent trend. Analysts said: "Demand declined in the United States (down 16 tons, down 2% year-on-year) and Japan (down 19 tons, down 4% year-on-year); while demand remained stable in South Korea (up 7 tons, up 1% year-on-year) and mainland China and Hong Kong (up 21 tons, flat year-on-year)."
ETFs are driving demand growth: the US market contributed over 60%, with significant increases also seen in Europe.
Meanwhile, ETFs once again dominated aggregate demand growth, with US-listed ETFs increasing their gold holdings by 137 tons in the third quarter, a year-on-year increase of 160%, bringing total holdings to 1,922 tons and assets under management (AUM) to $236 billion. The World Gold Council stated that gold ETFs were a key support this quarter, amid declining demand in other key sectors.
Analysts wrote, "Gold ETFs had a record performance in the third quarter, with net global inflows reaching $26 billion and total holdings increasing by 222 tons to 3,838 tons." "The contribution from the US market was particularly significant, accounting for 137 tons ($16 billion) of global demand, a staggering 62%." "This surge has profoundly reshaped the overall landscape of US gold demand."
"If we replace the ETF holdings increase in the third quarter with the 10-year average of 21 tons—even if we calculate based on the previous quarter's 70 tons—total demand this quarter would decrease by 44% or 4% respectively, instead of achieving a 50% quarter-on-quarter increase."
They added, "As of September, North American gold ETFs had seen a net inflow of $37 billion year-to-date—99% of which came from US-based funds—on track for their best annual performance ever, a milestone already confirmed by preliminary October data." Demand has also been strong in terms of tonnage, with North American funds now poised to rank among the top three performers this year.
(ETF holdings trend chart; ETF holdings have increased for three consecutive quarters)
Trading volume surged: September-October saw record highs driven by gold price volatility.
Analysts at the World Gold Council also provided an in-depth analysis of trading volume performance in the United States and other core markets. They noted: "In the third quarter, the average daily trading volume of futures and options on the New York Mercantile Exchange (COMEX) reached $104 billion (915 tons), a year-on-year increase of 35%; the average daily trading volume of North American ETFs (dominated by US funds) reached $5 billion (42 tons), a surge of 109% year-on-year." "The two combined contributed 33% of global market liquidity."
"Although U.S. trading volume declined month-on-month, this was mainly due to the sideways consolidation of gold prices in July and August, resulting in relatively sluggish trading activity." "Gold began its rebound in September, hitting 13 new historical highs, pushing U.S. trading volume to a record level of $138 billion (1,152 tons) per day, a 59% increase month-on-month, indicating a return of market momentum."
Analysts say this strong momentum continued into October, with gold prices hitting 11 more record highs, bringing the year-to-date total to 50. They stated, "The rebound was followed by an 8% pullback at the end of the month, exacerbating market volatility and driving a 51% month-over-month increase in U.S. trading volume, setting a new record of $208 billion (1587 tons) per day."
(Gold trading volume chart: both volume and price rose in the third quarter)
Institutional gold price forecast
The median and average of gold price forecasts both fall around 3800, and the price of gold futures contracts has generally been higher than the forecasts of various institutions in years of statistical practice.
(Bar chart of institutional gold price forecasts)
Summarize:
Considering that overall demand for gold only increased by 3% while prices rose by more than 40%, this is a disguised divergence between volume and price, meaning that there was no significant increase in demand during the price increase.
Meanwhile, looking at the central bank, gold ETFs, and jewelry consumption, which are the largest demand drivers, central bank gold purchases are slowing down, and jewelry transaction demand is also slowing down significantly.
The rapid increase in holdings of gold ETFs in the third quarter highlights their trading nature, which may lead to the possibility of chasing highs and selling lows. This means that these funds are more susceptible to emotional factors and even technical aspects of the market.
In conclusion, geopolitical issues and the status of the US dollar as a reserve currency will be reflected in the behavior of the aforementioned gold buyers.
The fact that global gold demand has not increased significantly but prices have risen sharply casts a shadow over further price increases for gold.
However, if gold prices fall or the technical pattern is corrected, gold's consumer appeal or ETF buying could push prices up again. At the same time, the gold purchases by central banks around the world are also a key area to monitor.
- Risk Warning and Disclaimer
- The market involves risk, and trading may not be suitable for all investors. This article is for reference only and does not constitute personal investment advice, nor does it take into account certain users’ specific investment objectives, financial situation, or other needs. Any investment decisions made based on this information are at your own risk.