


Gold Outlook: Gold Seeks Direction
2025-11-25 01:15:13
On Monday (November 24th) during the US session, gold prices saw a strong late-day rally, indicating bullish momentum. Gold rose 0.81% intraday, but lacked substantial momentum, and whether a more significant rebound can be achieved remains to be seen. Recently, the precious metal has been consolidating sideways, fluctuating narrowly between $4000 and $4100, a range of only $100. Daily closing prices have consistently hovered in the upper part of this range, and the long upper and lower shadows suggest that neither bulls nor bears have formed a firm conviction to dominate the market. With a strengthening dollar, volatile stock markets, pressure on the bond market, and similar volatility in the cryptocurrency market, the outlook for gold remains constrained by conflicting market headwinds.

White Paper: Factors that may influence the future price movements of gold and silver
A potential positive factor for the gold outlook lies in the possibility that the Federal Reserve may shift back to a dovish stance. After weeks of repricing hawkish expectations, the market tone shifted last Friday. Fed official Williams stated that risks in the labor market had increased, making him open to an early rate cut, which subsequently stabilized and boosted both stocks and gold. The economic data released that day was less than optimistic; if this week's data continues this weak trend, market expectations for a December rate cut are likely to strengthen further—a scenario that could provide a much-needed boost to gold and silver prices.
Market sentiment remains fragile, and gold's price action may be dominated by stock market volatility: even Nvidia's strong earnings report failed to dispel the risk aversion gripping the market. Concerns about overvaluation, rising Japanese government bond yields, and a lack of new catalysts continue to weigh on stock market gains. The plunge in the Japanese bond market may be the biggest uncertainty: soaring yields could trigger a wave of unwinding of yen-funded carry trades. If this happens, leveraged positions in tech stocks, cryptocurrencies, and even precious metals will be at risk.
Technical Analysis
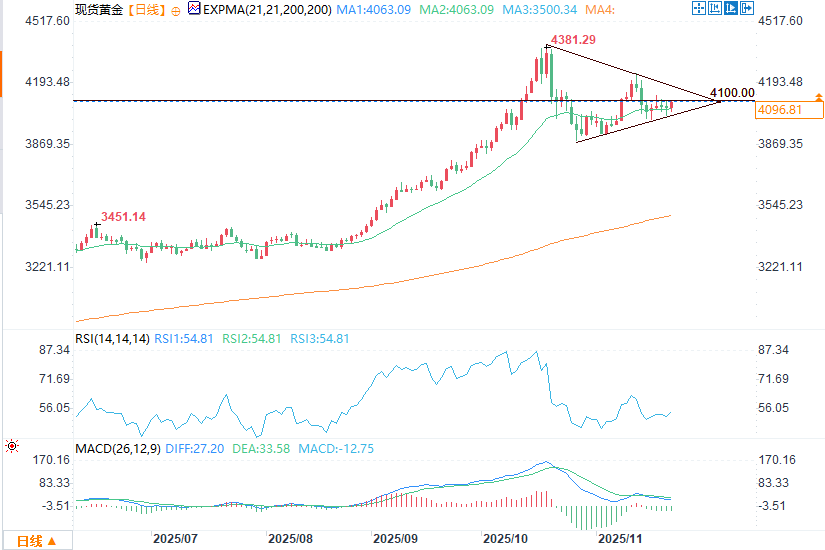
(Spot gold daily chart source: FX678)
From a price action perspective, gold successfully held the $4,000 mark last week, a small but significant breakthrough. The market is currently in a consolidation phase: while holding this key support level, a series of lower highs are forming. Downward momentum appears to have been contained so far, but this may only be a temporary respite. Another key level to watch is around $4,045, which has repeatedly shown support, with no daily closing price falling below this level. However, the real battleground between bulls and bears remains the $4,000 mark: a decisive break below this psychologically important level could trigger further technical selling, giving the bears dominance. Currently, gold prices holding above this level keep the outlook neutral—but this is only a marginal possibility.
On the upside, $4,100 is the first major resistance level on the spot gold technical chart. Gold has failed to close above this level for five consecutive trading days, and its transformation into resistance, previously acting as support, adds a slight bearish bias to the market. Further up is the more crucial $4,145-$4,160 range – a former support zone that was broken during the recent decline, making a retest of this range highly probable.
White Paper: Factors that may influence the future price movements of gold and silver
A potential positive factor for the gold outlook lies in the possibility that the Federal Reserve may shift back to a dovish stance. After weeks of repricing hawkish expectations, the market tone shifted last Friday. Fed official Williams stated that risks in the labor market had increased, making him open to an early rate cut, which subsequently stabilized and boosted both stocks and gold. The economic data released that day was less than optimistic; if this week's data continues this weak trend, market expectations for a December rate cut are likely to strengthen further—a scenario that could provide a much-needed boost to gold and silver prices.
Market sentiment remains fragile, and gold's price action may be dominated by stock market volatility: even Nvidia's strong earnings report failed to dispel the risk aversion gripping the market. Concerns about overvaluation, rising Japanese government bond yields, and a lack of new catalysts continue to weigh on stock market gains. The plunge in the Japanese bond market may be the biggest uncertainty: soaring yields could trigger a wave of unwinding of yen-funded carry trades. If this happens, leveraged positions in tech stocks, cryptocurrencies, and even precious metals will be at risk.
Technical Analysis
(Spot gold daily chart source: FX678)
From a price action perspective, gold successfully held the $4,000 mark last week, a small but significant breakthrough. The market is currently in a consolidation phase: while holding this key support level, a series of lower highs are forming. Downward momentum appears to have been contained so far, but this may only be a temporary respite. Another key level to watch is around $4,045, which has repeatedly shown support, with no daily closing price falling below this level. However, the real battleground between bulls and bears remains the $4,000 mark: a decisive break below this psychologically important level could trigger further technical selling, giving the bears dominance. Currently, gold prices holding above this level keep the outlook neutral—but this is only a marginal possibility.
On the upside, $4,100 is the first major resistance level on the spot gold technical chart. Gold has failed to close above this level for five consecutive trading days, and its transformation into resistance, previously acting as support, adds a slight bearish bias to the market. Further up is the more crucial $4,145-$4,160 range – a former support zone that was broken during the recent decline, making a retest of this range highly probable.
- Risk Warning and Disclaimer
- The market involves risk, and trading may not be suitable for all investors. This article is for reference only and does not constitute personal investment advice, nor does it take into account certain users’ specific investment objectives, financial situation, or other needs. Any investment decisions made based on this information are at your own risk.


