Data slowdown and easing geopolitical risks pressured the US dollar index, causing it to fall below the 100 mark.
2025-11-25 21:47:56
On Tuesday (November 25), the US dollar index continued its downward trend, breaking through the upward trend line in conjunction with news. It is currently trading around 99.96. According to US officials, Ukraine has agreed to the terms of the peace agreement. Some minor details of the peace agreement have not yet been finalized. The 19-point Ukraine peace plan no longer includes amnesty clauses. Market risk aversion has eased, putting pressure on the US dollar index.
Meanwhile, the US dollar index continued to be under pressure due to lower-than-expected ADP and September core PPI data, as well as lower-than-expected September retail sales figures.
Last Friday, New York Fed President John Williams clearly stated that the Fed is expected to initiate interest rate cuts "in the near term," and that this move will not have a substantial impact on the inflation control target.
San Francisco Fed President Mary Daly later added that the sudden deterioration in the job market was a key reason for cutting interest rates.
The market reacted strongly and immediately.
Later, both Waller and Milan, two dovish members, also believed that the employment data could persuade other members of the Federal Reserve to cut interest rates.
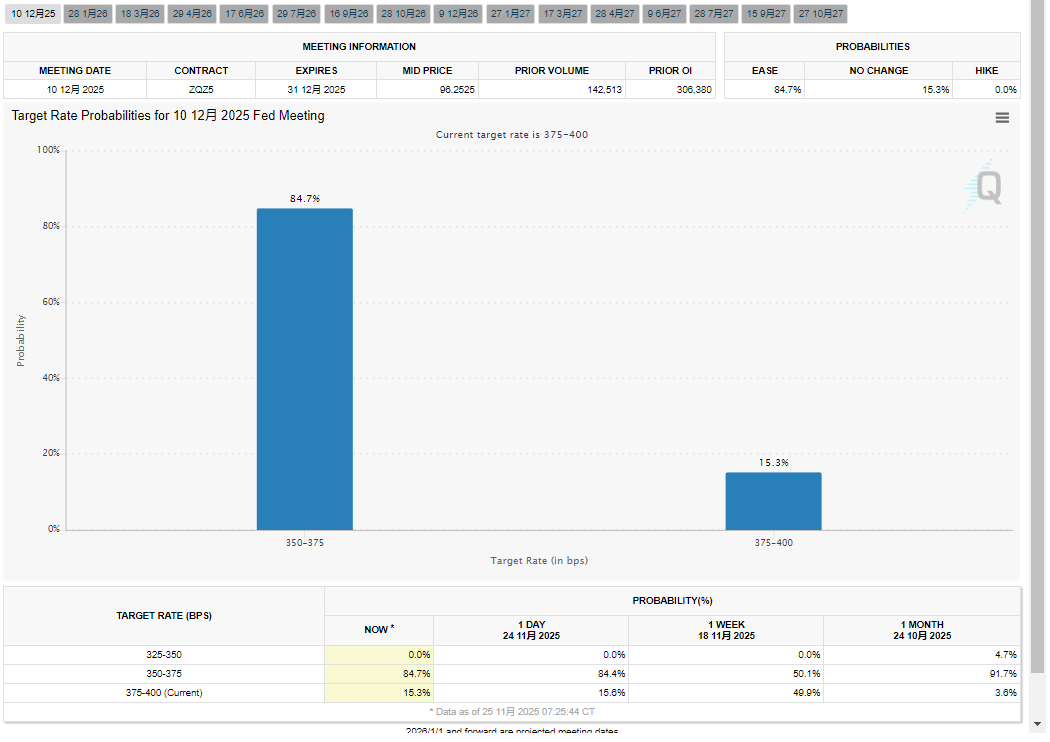
Data from the CME FedWatch Tool shows that traders are now pricing in a 25-basis-point rate cut in December, up to nearly 85%, a significant jump from 30% a week ago.
The rapid rise in expectations of monetary easing directly triggered a collective weakening of the US dollar against major G10 currencies.
Latest data shows that private companies have lost an average of 13,500 jobs per week over the past four weeks, an acceleration from the 2,500 job losses per week reported a week ago. As the previous government shutdown continues to affect data releases, alternative data like ADP have been filling the gaps in the economic picture, resulting in the ADP showing an accelerating deterioration.
The PPI is expected to rise by 2.7% year-on-year, and the actual increase was 2.7%, while it remained flat. Meanwhile, retail sales are expected to increase by 0.4% month-on-month, and the actual increase was 0.2%.
While the PPI has temporarily eased the threat of inflation, lower-than-expected ADP and sales data could significantly limit the upside potential of the dollar index and increase dovish expectations in the market.
Consumer confidence improved marginally. The University of Michigan's November Consumer Confidence Index came in at 51, slightly higher than the preliminary reading of 50.3, but still lower than October's 53.6.
Inflation expectations showed a moderate decline: the one-year inflation expectation fell from 4.7% to 4.5%, and the five-year inflation expectation fell from 3.6% to 3.4%.
This data reflects a marginal recovery in US household confidence, but caution regarding inflationary pressures has not completely dissipated.
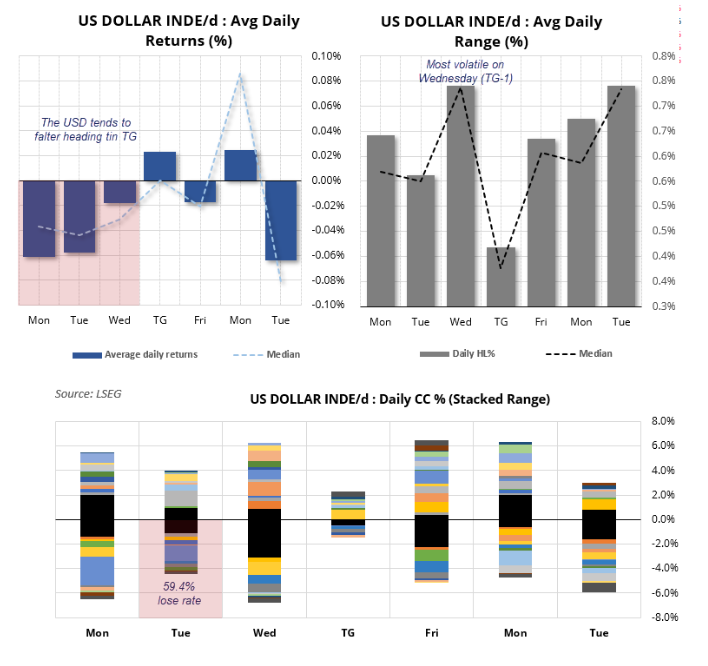
The Thanksgiving cycle reveals a clear pattern in the US dollar's movements: Looking back at historical data since 1985, the US dollar index has an average negative return on the three trading days before the holiday (Monday, Tuesday, and Wednesday), with an upward probability of less than 50%, and a downward probability as high as 59.4% on Tuesday.
The average daily volatility and median volatility both peaked at 0.74% on Wednesday, the eve of Thanksgiving. This data indicates that the volatility during this period is highly regular and not dominated by extreme market conditions.
On Thanksgiving Day, with the US futures market closed, volatility drops to a cyclical low; however, as traders return to the market after the holiday and refocus on core macroeconomic issues, volatility will increase again. The high degree of correlation between median and average daily volatility further validates the reliability of this seasonal pattern.
Although the average return was slightly positive on Thanksgiving Day and the first full trading day after Thanksgiving (the second Monday after Thanksgiving), the median return on Thanksgiving Day was flat, while the median performance on the Monday after Thanksgiving was stronger.
Judging from the trend, the weakening of the US dollar before the long holiday remains the core theme. US market dynamics show that the US dollar index is under slight downward pressure, and the market is continuing to digest the expectation of further monetary easing in December.
However, the US dollar has actually shown strong resilience. Faced with the increased probability of interest rate cuts and the waning of risk aversion due to the easing of the Russia-Ukraine conflict, the US dollar index had previously shown resilience. However, under the dual influence of traders weighing the rising expectations of interest rate cuts and the divergent statements from Federal Reserve officials, the US dollar index bulls found it difficult to resist.
With the release of the US Conference Board Consumer Confidence Index for November and the US Pending Home Sales data for October, coupled with a flurry of statements from Federal Reserve officials, investors are adopting defensive trading strategies and adopting a cautious overall stance.
The short-term trend of the US dollar will depend heavily on the performance of core data such as inflation and labor, as well as clear policy signals released by policymakers. If the start of the easing cycle is confirmed, the US dollar index will remain under pressure until the end of the year.
Rising expectations of easing have limited the upside potential of the US dollar index, but looking at specific currency pairs, the USD/JPY pair also faces challenges – especially given the recent frequent window guidance from Japanese officials and the yen's subsequent appreciation after a period of rapid depreciation. This has put significant downward pressure on the USD/JPY pair.
Investors can then focus on the upcoming supplementary indicators for the US housing and manufacturing sectors.
However, the key is to grasp the major labor market and inflation data, as well as the exchange rates of the US dollar and the US dollar, and the US dollar and the Japanese yen, and to provide key guidance on the trend of the US dollar index before the next round of policy communication by the Federal Reserve.
The recent stagnation of the US dollar index suggests the end of the rebound. Currently, the US dollar index has fallen below the upward trend line and the five-day moving average, breaking the strong upward trend.
However, it is worth noting that if the US dollar index recovers its upward trend line, it still retains the possibility of continuing to rise, although this may conflict with fundamentals.
The nearest support level is currently at 99.84, followed by 99.60 and finally 99.36.
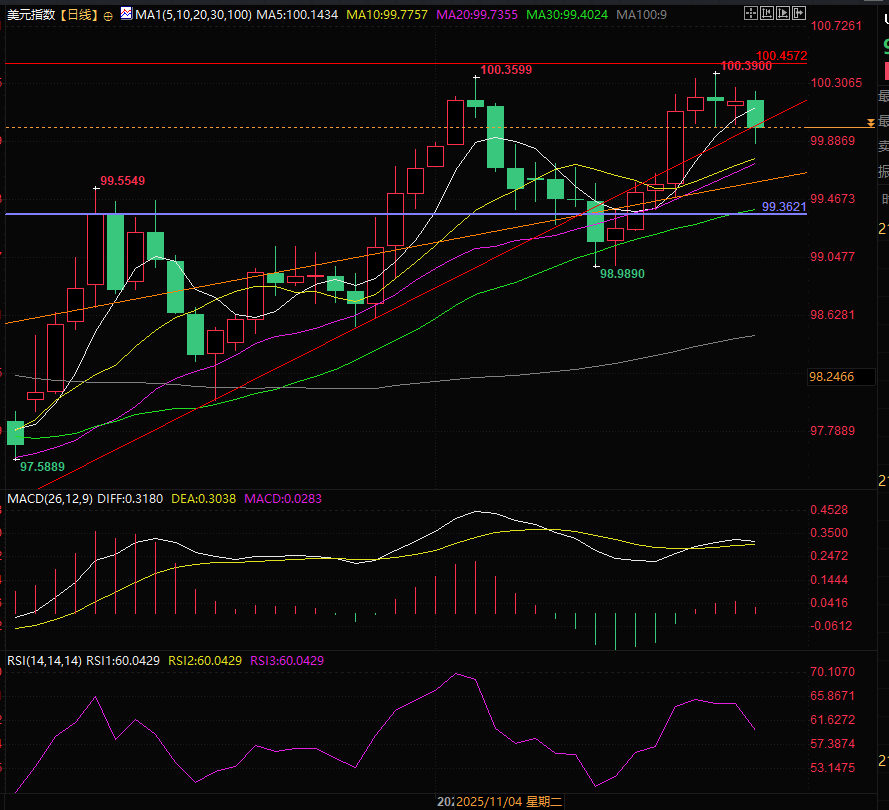
(US Dollar Index Daily Chart, Source: FX678)
At 21:44 Beijing time, the US dollar index is currently at 99.96.
Meanwhile, the US dollar index continued to be under pressure due to lower-than-expected ADP and September core PPI data, as well as lower-than-expected September retail sales figures.
Expectations of interest rate cuts plummeted, putting pressure on the dollar index.
Last Friday, New York Fed President John Williams clearly stated that the Fed is expected to initiate interest rate cuts "in the near term," and that this move will not have a substantial impact on the inflation control target.
San Francisco Fed President Mary Daly later added that the sudden deterioration in the job market was a key reason for cutting interest rates.
The market reacted strongly and immediately.
Later, both Waller and Milan, two dovish members, also believed that the employment data could persuade other members of the Federal Reserve to cut interest rates.
Data from the CME FedWatch Tool shows that traders are now pricing in a 25-basis-point rate cut in December, up to nearly 85%, a significant jump from 30% a week ago.
The rapid rise in expectations of monetary easing directly triggered a collective weakening of the US dollar against major G10 currencies.
The release of key data fell short of expectations, and the rapidly deteriorating ADP report weighed on the US dollar.
Latest data shows that private companies have lost an average of 13,500 jobs per week over the past four weeks, an acceleration from the 2,500 job losses per week reported a week ago. As the previous government shutdown continues to affect data releases, alternative data like ADP have been filling the gaps in the economic picture, resulting in the ADP showing an accelerating deterioration.
The PPI is expected to rise by 2.7% year-on-year, and the actual increase was 2.7%, while it remained flat. Meanwhile, retail sales are expected to increase by 0.4% month-on-month, and the actual increase was 0.2%.
While the PPI has temporarily eased the threat of inflation, lower-than-expected ADP and sales data could significantly limit the upside potential of the dollar index and increase dovish expectations in the market.
Inflation concerns persist, and the economic slowdown remains unchanged.
Consumer confidence improved marginally. The University of Michigan's November Consumer Confidence Index came in at 51, slightly higher than the preliminary reading of 50.3, but still lower than October's 53.6.
Inflation expectations showed a moderate decline: the one-year inflation expectation fell from 4.7% to 4.5%, and the five-year inflation expectation fell from 3.6% to 3.4%.
This data reflects a marginal recovery in US household confidence, but caution regarding inflationary pressures has not completely dissipated.
With Thanksgiving approaching, the US dollar index is under pressure.
The Thanksgiving cycle reveals a clear pattern in the US dollar's movements: Looking back at historical data since 1985, the US dollar index has an average negative return on the three trading days before the holiday (Monday, Tuesday, and Wednesday), with an upward probability of less than 50%, and a downward probability as high as 59.4% on Tuesday.
The average daily volatility and median volatility both peaked at 0.74% on Wednesday, the eve of Thanksgiving. This data indicates that the volatility during this period is highly regular and not dominated by extreme market conditions.
On Thanksgiving Day, with the US futures market closed, volatility drops to a cyclical low; however, as traders return to the market after the holiday and refocus on core macroeconomic issues, volatility will increase again. The high degree of correlation between median and average daily volatility further validates the reliability of this seasonal pattern.
Although the average return was slightly positive on Thanksgiving Day and the first full trading day after Thanksgiving (the second Monday after Thanksgiving), the median return on Thanksgiving Day was flat, while the median performance on the Monday after Thanksgiving was stronger.
Market Outlook:
Judging from the trend, the weakening of the US dollar before the long holiday remains the core theme. US market dynamics show that the US dollar index is under slight downward pressure, and the market is continuing to digest the expectation of further monetary easing in December.
However, the US dollar has actually shown strong resilience. Faced with the increased probability of interest rate cuts and the waning of risk aversion due to the easing of the Russia-Ukraine conflict, the US dollar index had previously shown resilience. However, under the dual influence of traders weighing the rising expectations of interest rate cuts and the divergent statements from Federal Reserve officials, the US dollar index bulls found it difficult to resist.
With the release of the US Conference Board Consumer Confidence Index for November and the US Pending Home Sales data for October, coupled with a flurry of statements from Federal Reserve officials, investors are adopting defensive trading strategies and adopting a cautious overall stance.
The short-term trend of the US dollar will depend heavily on the performance of core data such as inflation and labor, as well as clear policy signals released by policymakers. If the start of the easing cycle is confirmed, the US dollar index will remain under pressure until the end of the year.
Rising expectations of easing have limited the upside potential of the US dollar index, but looking at specific currency pairs, the USD/JPY pair also faces challenges – especially given the recent frequent window guidance from Japanese officials and the yen's subsequent appreciation after a period of rapid depreciation. This has put significant downward pressure on the USD/JPY pair.
Investors can then focus on the upcoming supplementary indicators for the US housing and manufacturing sectors.
However, the key is to grasp the major labor market and inflation data, as well as the exchange rates of the US dollar and the US dollar, and the US dollar and the Japanese yen, and to provide key guidance on the trend of the US dollar index before the next round of policy communication by the Federal Reserve.
Technical Analysis:
The recent stagnation of the US dollar index suggests the end of the rebound. Currently, the US dollar index has fallen below the upward trend line and the five-day moving average, breaking the strong upward trend.
However, it is worth noting that if the US dollar index recovers its upward trend line, it still retains the possibility of continuing to rise, although this may conflict with fundamentals.
The nearest support level is currently at 99.84, followed by 99.60 and finally 99.36.
(US Dollar Index Daily Chart, Source: FX678)
At 21:44 Beijing time, the US dollar index is currently at 99.96.
- Risk Warning and Disclaimer
- The market involves risk, and trading may not be suitable for all investors. This article is for reference only and does not constitute personal investment advice, nor does it take into account certain users’ specific investment objectives, financial situation, or other needs. Any investment decisions made based on this information are at your own risk.