WTI crude oil fluctuated slightly higher, with the 50-day moving average becoming the focus again.
2025-12-04 19:33:59
On Thursday (December 3), WTI crude oil futures rose slightly during the European session, reaching $59.24 per barrel, up 0.49%, as the market attempted to stabilize after several rounds of volatile trading.

If oil prices maintain a moderate upward trend, the 50-day moving average at $59.92 will once again become the market focus. This indicator has repeatedly suppressed rallies since late October, becoming the first real test for the bulls. If it can be successfully broken, market attention will turn to the 100-day moving average at $62.15.
On the downside, if oil prices fall, they will test the 23.6% Fibonacci retracement level at $58.39. Buyers need to actively enter the market at this level to maintain the current upward trend; if buying is insufficient, oil prices may further test the recent swing low of $57.10 (a key area where value buyers previously entered the market).
The attack in Ukraine has triggered new supply risks.
Geopolitical risks have returned to the forefront of markets following Ukraine's attack on the Druzhba pipeline in Russia's Tambov region—the fifth attack on the pipeline that supplies oil to Hungary and Slovakia. The operator stated that transport is continuing, but the frequent attacks were enough to push crude oil prices higher in early trading.
Kpler, an energy consultancy firm, points out that Ukraine's drone strikes against Russian refining assets have entered a cyclical pattern, aimed at keeping critical facilities shut down. From September to November this year, Russian refinery throughput fell to approximately 5 million barrels per day, a decrease of 335,000 barrels per day year-on-year. Gasoline production was hit hardest, and diesel production also declined significantly.
Will stalled peace talks change oil price forecasts?
Negotiations between US representatives and the Kremlin have stalled, with President Trump stating there is currently no clear path forward. Traders had previously priced in the possibility that an agreement would ease sanctions, allowing more Russian crude oil into an already oversupplied market. With the negotiations failing to break through, this pressure has subsided, helping to stabilize oil prices.
Fitch's downward revision of forecasts weighs on oil price outlook
Fitch Ratings has lowered its oil price forecasts for 2025-2027, citing persistent oversupply and projected production growth outpacing demand growth. This downgrade highlights the broad-based fundamental drags still facing the market.
Technical Analysis
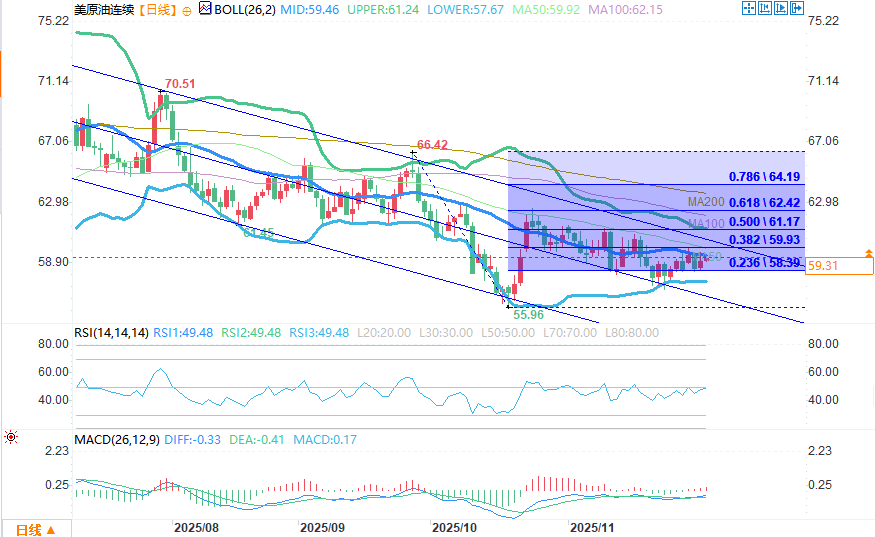
(WTI crude oil daily chart source: FX678)
The current trend of WTI crude oil is in the "short-term stabilization phase under a medium-term downtrend".
From a Fibonacci retracement perspective, a ratio line drawn using the previous high of 66.42 and the recent low of 55.96 as the range shows that the current price (59.33) is above the 0.236 support level (58.39) and close to the 0.382 support level (59.93). This means that the pullback has entered a shallow retracement zone. If 58.39 can be held, the short-term downside will be relatively limited, and there is potential for a rebound.
The moving averages show a divergence in trends: the long-term moving averages MA100 (approximately 61.17) and MA200 (approximately 62.42) are both above the price and turning downwards, indicating that the medium-term downtrend has not yet reversed; however, the short-term price has rebounded from the low of 57.10 and is gradually approaching MA50 (59.92), and the decline has been temporarily eased.
The current price is near the middle Bollinger Band (59.46), with the upper band at 61.24 and the lower band at 57.67. This indicates that the short-term price is in the middle of the oscillation range. A breakout above the middle band could test the upper band resistance, while a breakout below the lower band at 57.67 (close to the previous low of 57.10) should be monitored.
The indicator signals further confirm the stalemate between bulls and bears: the RSI value (49.58) is close to the 50 neutral line, with neither overbought nor oversold conditions, indicating that the forces of bulls and bears are in balance; the MACD's DIF and DEA are still below the zero axis, but the green bars continue to shrink, indicating that the bearish momentum is weakening, but the bulls have not yet formed a strong counterattack momentum.
In summary, short-term trading should focus on key price levels: if the support at 58.39 holds, a small position can be taken to target a rebound to the resistance at 59.93; if it falls below 58.39, be wary of a potential retest of the low at 57.10.
If oil prices maintain a moderate upward trend, the 50-day moving average at $59.92 will once again become the market focus. This indicator has repeatedly suppressed rallies since late October, becoming the first real test for the bulls. If it can be successfully broken, market attention will turn to the 100-day moving average at $62.15.
On the downside, if oil prices fall, they will test the 23.6% Fibonacci retracement level at $58.39. Buyers need to actively enter the market at this level to maintain the current upward trend; if buying is insufficient, oil prices may further test the recent swing low of $57.10 (a key area where value buyers previously entered the market).
The attack in Ukraine has triggered new supply risks.
Geopolitical risks have returned to the forefront of markets following Ukraine's attack on the Druzhba pipeline in Russia's Tambov region—the fifth attack on the pipeline that supplies oil to Hungary and Slovakia. The operator stated that transport is continuing, but the frequent attacks were enough to push crude oil prices higher in early trading.
Kpler, an energy consultancy firm, points out that Ukraine's drone strikes against Russian refining assets have entered a cyclical pattern, aimed at keeping critical facilities shut down. From September to November this year, Russian refinery throughput fell to approximately 5 million barrels per day, a decrease of 335,000 barrels per day year-on-year. Gasoline production was hit hardest, and diesel production also declined significantly.
Will stalled peace talks change oil price forecasts?
Negotiations between US representatives and the Kremlin have stalled, with President Trump stating there is currently no clear path forward. Traders had previously priced in the possibility that an agreement would ease sanctions, allowing more Russian crude oil into an already oversupplied market. With the negotiations failing to break through, this pressure has subsided, helping to stabilize oil prices.
Fitch's downward revision of forecasts weighs on oil price outlook
Fitch Ratings has lowered its oil price forecasts for 2025-2027, citing persistent oversupply and projected production growth outpacing demand growth. This downgrade highlights the broad-based fundamental drags still facing the market.
Technical Analysis
(WTI crude oil daily chart source: FX678)
The current trend of WTI crude oil is in the "short-term stabilization phase under a medium-term downtrend".
From a Fibonacci retracement perspective, a ratio line drawn using the previous high of 66.42 and the recent low of 55.96 as the range shows that the current price (59.33) is above the 0.236 support level (58.39) and close to the 0.382 support level (59.93). This means that the pullback has entered a shallow retracement zone. If 58.39 can be held, the short-term downside will be relatively limited, and there is potential for a rebound.
The moving averages show a divergence in trends: the long-term moving averages MA100 (approximately 61.17) and MA200 (approximately 62.42) are both above the price and turning downwards, indicating that the medium-term downtrend has not yet reversed; however, the short-term price has rebounded from the low of 57.10 and is gradually approaching MA50 (59.92), and the decline has been temporarily eased.
The current price is near the middle Bollinger Band (59.46), with the upper band at 61.24 and the lower band at 57.67. This indicates that the short-term price is in the middle of the oscillation range. A breakout above the middle band could test the upper band resistance, while a breakout below the lower band at 57.67 (close to the previous low of 57.10) should be monitored.
The indicator signals further confirm the stalemate between bulls and bears: the RSI value (49.58) is close to the 50 neutral line, with neither overbought nor oversold conditions, indicating that the forces of bulls and bears are in balance; the MACD's DIF and DEA are still below the zero axis, but the green bars continue to shrink, indicating that the bearish momentum is weakening, but the bulls have not yet formed a strong counterattack momentum.
In summary, short-term trading should focus on key price levels: if the support at 58.39 holds, a small position can be taken to target a rebound to the resistance at 59.93; if it falls below 58.39, be wary of a potential retest of the low at 57.10.
- Risk Warning and Disclaimer
- The market involves risk, and trading may not be suitable for all investors. This article is for reference only and does not constitute personal investment advice, nor does it take into account certain users’ specific investment objectives, financial situation, or other needs. Any investment decisions made based on this information are at your own risk.