Non-farm payrolls related: 68 indicators reveal the US job market, with a bullish/bearish ratio of 0.33 for gold.
2025-12-16 16:03:58
One chart: Of the 68 US employment-related indicators, only 15 are bullish for gold. The latest US non-farm payroll data will be released on December 16, 2025 at 21:30, and the market is paying close attention. The US non-farm payroll data, considered an essential indicator for financial markets, will likely impact the market. The answer will be revealed tonight. This original chart may offer a glimpse into the future.
[In the table, among the 68 US employment market indicators, comparing the latest values of the previous non-farm payrolls and related indicators with the previous values, there are 15 bullish indicators for gold, 46 bearish indicators, and 7 neutral indicators. The number of bearish indicators exceeds the number of bullish indicators, indicating an overall bearish trend. There are 15 bullish indicators for gold (bullish/bearish ratio 0.33).]
Regarding crude oil, theoretically, US indicators that are bullish for gold are bearish for oil prices. However, it's worth noting that when the market reacts to data such as US non-farm payrolls, oil prices typically move in the opposite direction to the US dollar briefly (the so-called market knee-jerk reaction), but crude oil quickly recovers and moves in the same direction as the US dollar index (which can be interpreted as a reaction to the strength of fundamentals).
The chart below reveals 68 indicators for the US job market ahead of the non-farm payrolls report, with 15 indicators positive for gold (positive/negative ratio 0.33, source: FX678, specially created chart).
Due to the length of the image, it has been split into two images, one above the other. The first image shows indicators 1-36, and the second image shows indicators 37-68.
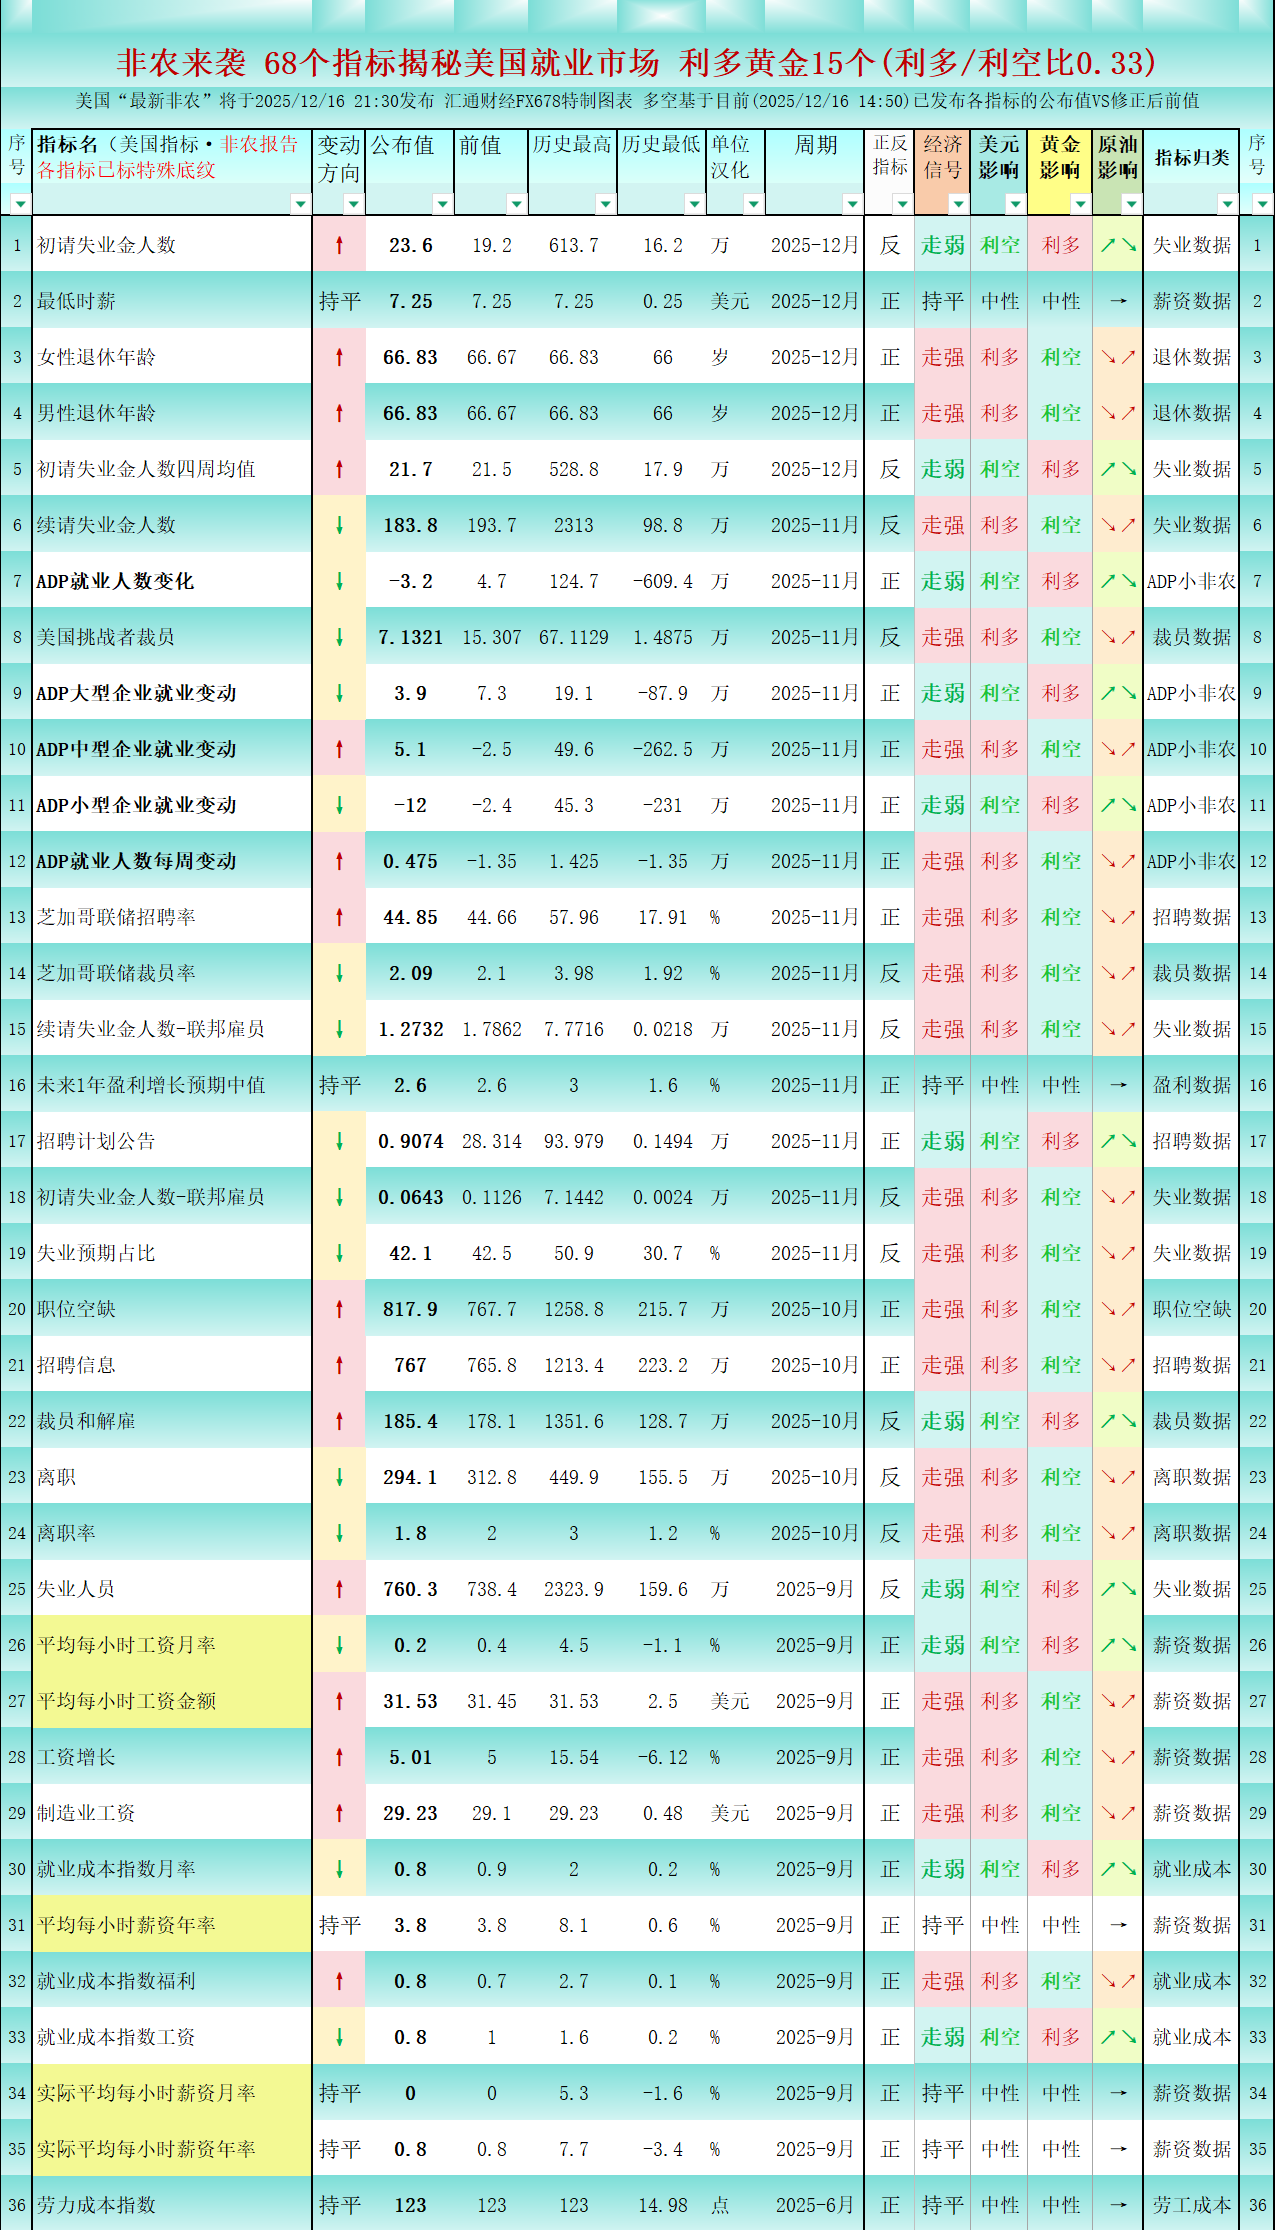
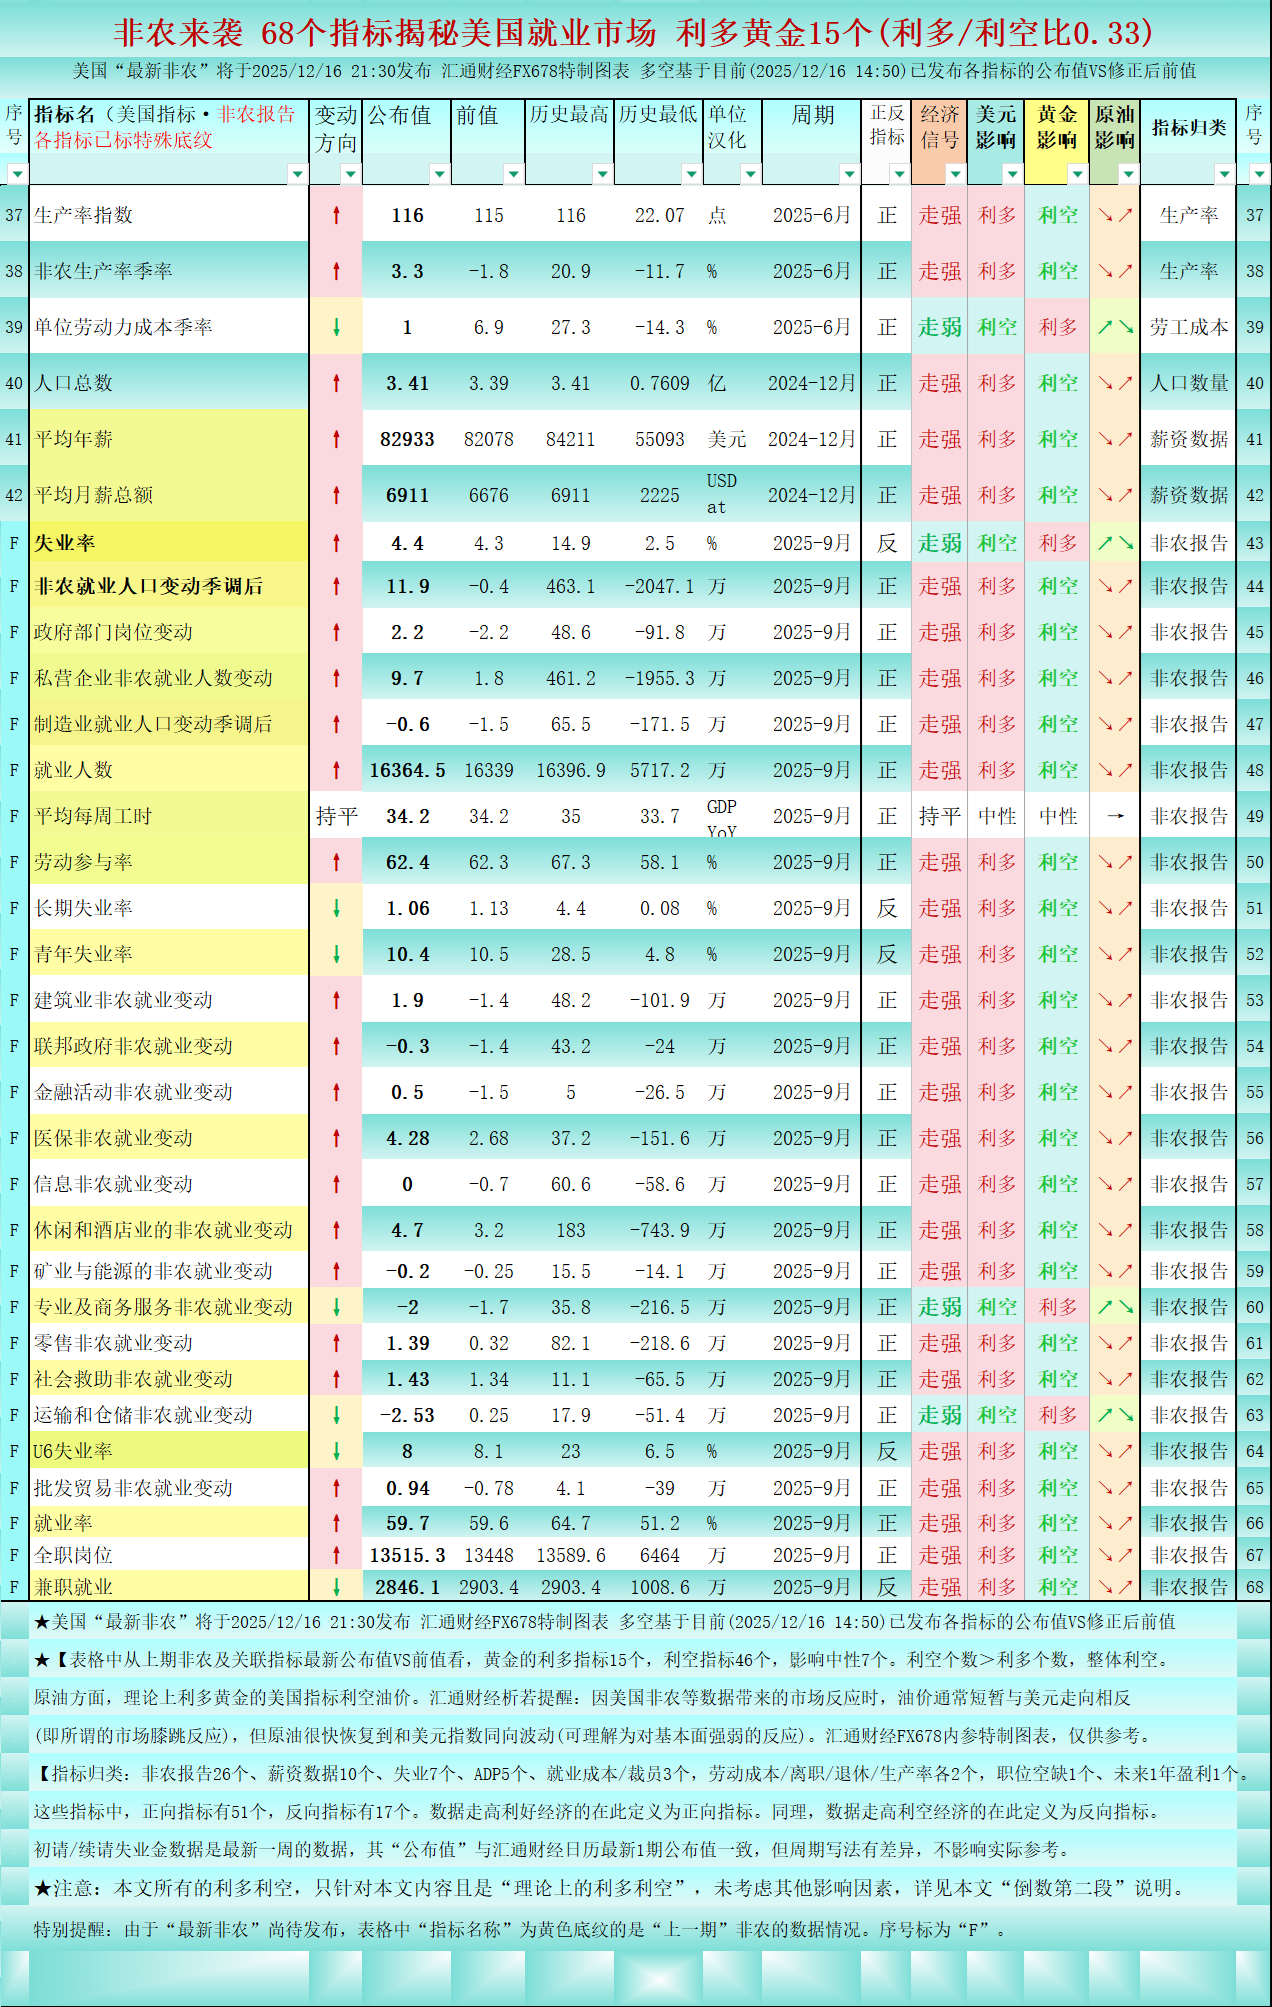
This chart is based on the comparison between the previous US non-farm payrolls report and the previous value, which is currently available (as of 14:50 on 2025/12/16).
Indicator Classification: 26 non-farm payroll reports, 10 wage data, 7 unemployment data, 5 ADP data, 3 employment costs/layoffs, 2 each of labor costs/turnover/retirement/productivity, 1 job opening, and 1 year-over-year earnings indicator. ★Of these indicators, 51 are positive and 17 are negative. Data that is positive for the economy is defined as a positive indicator. Similarly, data that is negative for the economy is defined as a negative indicator.
Note: All bullish and bearish factors mentioned in this article refer only to the 42 US employment indicators shown in the chart, without considering other influencing factors. Furthermore, these are all "theoretical bullish and bearish factors," and actual market movements may contradict the theory. For example, a classic case of "bad news turning into good news" or "good news turning into bad news" can occur, resulting in a situation where a theoretically positive event actually leads to a price drop, and vice versa. Another example: if a commodity is technically in a downtrend, positive factors may cause the price to surge, but after the surge, concentrated selling pressure could lead to a deeper drop. However, studying "theoretical bullish and bearish factors" can be an important reference for advance planning and analyzing trading decisions. How to use this reference specifically will depend on the trading environment formed by other factors, the trader's own trading strategy, and mindset.
This article is an original production of FX678 and is copyrighted. It is for reference only and should not be used as a basis for trading.
[For more non-farm payrolls previews, please see another article I wrote earlier:] The Most Comprehensive Non-Farm Payrolls Preview: Eight Charts at a Glance; The First Non-Farm Payrolls Report After the White House Shutdown May Be Very Poor.
[In the table, among the 68 US employment market indicators, comparing the latest values of the previous non-farm payrolls and related indicators with the previous values, there are 15 bullish indicators for gold, 46 bearish indicators, and 7 neutral indicators. The number of bearish indicators exceeds the number of bullish indicators, indicating an overall bearish trend. There are 15 bullish indicators for gold (bullish/bearish ratio 0.33).]
Regarding crude oil, theoretically, US indicators that are bullish for gold are bearish for oil prices. However, it's worth noting that when the market reacts to data such as US non-farm payrolls, oil prices typically move in the opposite direction to the US dollar briefly (the so-called market knee-jerk reaction), but crude oil quickly recovers and moves in the same direction as the US dollar index (which can be interpreted as a reaction to the strength of fundamentals).
The chart below reveals 68 indicators for the US job market ahead of the non-farm payrolls report, with 15 indicators positive for gold (positive/negative ratio 0.33, source: FX678, specially created chart).
Due to the length of the image, it has been split into two images, one above the other. The first image shows indicators 1-36, and the second image shows indicators 37-68.
This chart is based on the comparison between the previous US non-farm payrolls report and the previous value, which is currently available (as of 14:50 on 2025/12/16).
Indicator Classification: 26 non-farm payroll reports, 10 wage data, 7 unemployment data, 5 ADP data, 3 employment costs/layoffs, 2 each of labor costs/turnover/retirement/productivity, 1 job opening, and 1 year-over-year earnings indicator. ★Of these indicators, 51 are positive and 17 are negative. Data that is positive for the economy is defined as a positive indicator. Similarly, data that is negative for the economy is defined as a negative indicator.
Note: All bullish and bearish factors mentioned in this article refer only to the 42 US employment indicators shown in the chart, without considering other influencing factors. Furthermore, these are all "theoretical bullish and bearish factors," and actual market movements may contradict the theory. For example, a classic case of "bad news turning into good news" or "good news turning into bad news" can occur, resulting in a situation where a theoretically positive event actually leads to a price drop, and vice versa. Another example: if a commodity is technically in a downtrend, positive factors may cause the price to surge, but after the surge, concentrated selling pressure could lead to a deeper drop. However, studying "theoretical bullish and bearish factors" can be an important reference for advance planning and analyzing trading decisions. How to use this reference specifically will depend on the trading environment formed by other factors, the trader's own trading strategy, and mindset.
This article is an original production of FX678 and is copyrighted. It is for reference only and should not be used as a basis for trading.
[For more non-farm payrolls previews, please see another article I wrote earlier:] The Most Comprehensive Non-Farm Payrolls Preview: Eight Charts at a Glance; The First Non-Farm Payrolls Report After the White House Shutdown May Be Very Poor.
- Risk Warning and Disclaimer
- The market involves risk, and trading may not be suitable for all investors. This article is for reference only and does not constitute personal investment advice, nor does it take into account certain users’ specific investment objectives, financial situation, or other needs. Any investment decisions made based on this information are at your own risk.