Gold and silver prices fell, with silver's technical pattern causing panic among bulls.
2026-01-08 01:51:13
Gold and silver prices fell near midday in the U.S. trading session on Wednesday (January 7), mainly due to profit-taking by short-term futures traders. Strong technical resistance at record highs above current price levels also kept gold and silver bulls on the sidelines during the mid-week session. February gold futures were trading at $4467.2 per ounce, down $28.9; March silver futures were trading at $78.22 per ounce, down $2.819.
The daily chart for March Comex silver futures shows that this week's price action (especially today's sharp decline) may be forming a bearish double-top reversal pattern. The price action of silver for the remainder of the week is crucial for confirmation of this bearish double-top pattern. Traditional technical analysis suggests that a bearish double-top reversal pattern is confirmed when the price breaks below the trough between the two tops. In the current situation for silver, this means that the March futures price needs to break below $69.255/oz. Currently, there are likely many pre-placed stop-loss sell orders below this price level. Silver's daily price action may continue to lead gold prices.
In other news, the People's Bank of China (PBOC) has increased its gold reserves for 14 consecutive months, highlighting continued official demand for gold amid soaring prices to record highs. According to data released Wednesday, the PBOC added 30,000 ounces of gold last month. Since the start of the current accumulation cycle in November 2024, the PBOC has accumulated approximately 1.35 million ounces (42 tons) of gold. Gold prices have fluctuated in recent weeks after surging to record highs last fall. However, thanks to central bank purchases, geopolitical concerns, and devaluation trading (investors moving away from sovereign bonds and currency markets to alternative stores of value), gold has recorded its best annual performance since 1979.
Key external market developments today: The US dollar index strengthened slightly; crude oil prices fell, currently trading around $56.50 per barrel; the benchmark 10-year US Treasury yield is currently around 4.15%.
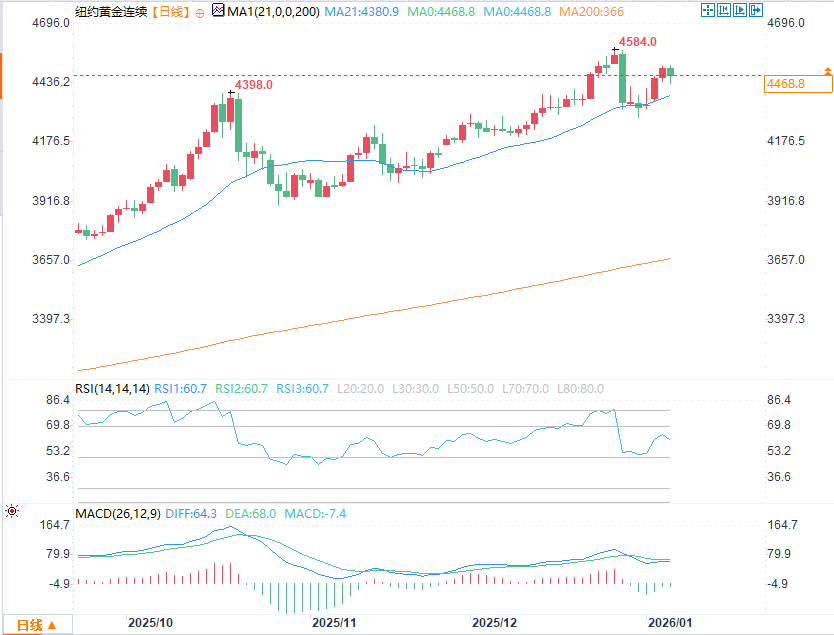
(COMEX Gold Daily Chart Source: FX678)
From a technical perspective, the next upside target for February gold futures bulls is a break above the strong resistance level of $4,584.00/oz, the contract high/record high. The near-term downside target for bears is to push futures prices below the strong technical support level of $4,200.00/oz. The first resistance level is seen at the overnight high of $4,512.40/oz, followed by $4,550.00/oz; the first support level is today's low of $4,432.90/oz, followed by $4,400.00/oz.
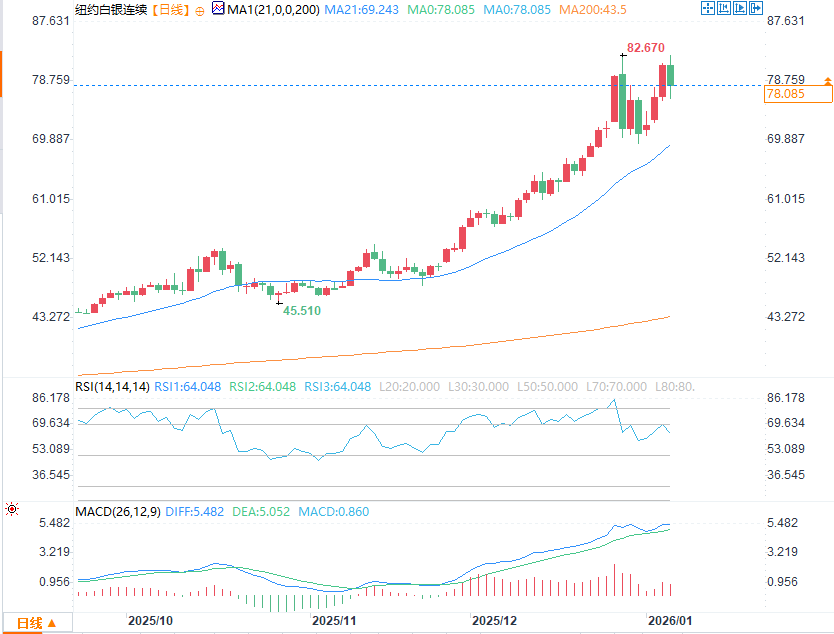
(COMEX silver daily chart source: FX678)
In March silver futures, today's price action has increased the likelihood of a bearish double-top reversal pattern forming on the daily chart. The next upside target for the bulls is a break above the strong technical resistance level of $82.67/oz, a record high; the next downside target for the bears is a break below the strong support level of last week's low of $69.225/oz. The first resistance level is seen at $79.00/oz, followed by $80.00/oz; the next support level is at $75.70/oz, followed by $75.00/oz.
Note: The gold market operates primarily through two pricing mechanisms. The first is the spot market, which quotes prices for immediate purchase and delivery; the second is the futures market, which determines the price for delivery on a future date. Due to year-end position adjustments and market liquidity, the most actively traded gold futures contract on the Chicago Mercantile Exchange (CME) is currently the December contract.
The daily chart for March Comex silver futures shows that this week's price action (especially today's sharp decline) may be forming a bearish double-top reversal pattern. The price action of silver for the remainder of the week is crucial for confirmation of this bearish double-top pattern. Traditional technical analysis suggests that a bearish double-top reversal pattern is confirmed when the price breaks below the trough between the two tops. In the current situation for silver, this means that the March futures price needs to break below $69.255/oz. Currently, there are likely many pre-placed stop-loss sell orders below this price level. Silver's daily price action may continue to lead gold prices.
In other news, the People's Bank of China (PBOC) has increased its gold reserves for 14 consecutive months, highlighting continued official demand for gold amid soaring prices to record highs. According to data released Wednesday, the PBOC added 30,000 ounces of gold last month. Since the start of the current accumulation cycle in November 2024, the PBOC has accumulated approximately 1.35 million ounces (42 tons) of gold. Gold prices have fluctuated in recent weeks after surging to record highs last fall. However, thanks to central bank purchases, geopolitical concerns, and devaluation trading (investors moving away from sovereign bonds and currency markets to alternative stores of value), gold has recorded its best annual performance since 1979.
Key external market developments today: The US dollar index strengthened slightly; crude oil prices fell, currently trading around $56.50 per barrel; the benchmark 10-year US Treasury yield is currently around 4.15%.
(COMEX Gold Daily Chart Source: FX678)
From a technical perspective, the next upside target for February gold futures bulls is a break above the strong resistance level of $4,584.00/oz, the contract high/record high. The near-term downside target for bears is to push futures prices below the strong technical support level of $4,200.00/oz. The first resistance level is seen at the overnight high of $4,512.40/oz, followed by $4,550.00/oz; the first support level is today's low of $4,432.90/oz, followed by $4,400.00/oz.
(COMEX silver daily chart source: FX678)
In March silver futures, today's price action has increased the likelihood of a bearish double-top reversal pattern forming on the daily chart. The next upside target for the bulls is a break above the strong technical resistance level of $82.67/oz, a record high; the next downside target for the bears is a break below the strong support level of last week's low of $69.225/oz. The first resistance level is seen at $79.00/oz, followed by $80.00/oz; the next support level is at $75.70/oz, followed by $75.00/oz.
Note: The gold market operates primarily through two pricing mechanisms. The first is the spot market, which quotes prices for immediate purchase and delivery; the second is the futures market, which determines the price for delivery on a future date. Due to year-end position adjustments and market liquidity, the most actively traded gold futures contract on the Chicago Mercantile Exchange (CME) is currently the December contract.
- Risk Warning and Disclaimer
- The market involves risk, and trading may not be suitable for all investors. This article is for reference only and does not constitute personal investment advice, nor does it take into account certain users’ specific investment objectives, financial situation, or other needs. Any investment decisions made based on this information are at your own risk.