Gold Weekly Price Outlook: Continued Upward Momentum
2026-01-10 00:37:43
Amid a continued complex and volatile global macroeconomic environment, the gold market has once again demonstrated strong upward resilience over the past week, with price fluctuations steadily shifting upwards. It is currently making a strong push towards and attempting to establish a foothold above the key psychological level of $4,500. Judging from the current market dynamics of bulls and bears, the bulls undoubtedly hold absolute dominance. The core question now lies in whether the bulls can maintain their momentum, successfully break through key resistance levels, and consolidate their gains.

Gold Market Weekly Technical Analysis
Looking back at the gold market performance this trading week, gold prices showed a fluctuating upward trend after the start of the week. Although there were occasional pullbacks during the session, strong buying support pushed prices closer to the $4,500 psychological and technical resistance level that the market is closely watching. One of the core driving events of the week—the US non-farm payroll data—was officially released earlier. The data showed that key indicators such as the number of new jobs and the unemployment rate were weaker than the market's general expectations. This weak economic data directly strengthened market expectations for further easing monetary policy from the Federal Reserve, leading to a slight weakening of the US dollar index, which provided a direct boost to the rise in gold prices. This also allowed the market to continue the recent core operating logic of "weak economic data → increased risk aversion → stronger gold prices".
From a technical support perspective, the area around $4,400 is gradually forming a significant bottom support zone for gold prices in the short term. It's important to clarify that $4,400 is not an absolutely precise support level, but rather a support range with a strong buffer, its effective support extending roughly to around $4,350. This range has formed for two reasons: firstly, the market has repeatedly found support and rebounded in this area in the past, creating a clear consensus among investors; secondly, from the perspective of moving averages, the $4,350-$4,400 range coincides with the intersection of the 5-week and 10-week moving averages, further strengthening the stability of this range with multiple technical supports. As long as gold prices can consistently remain above this support range, the current medium-term upward trend will not be substantially broken.
In contrast to the solid support below, the $4,600 level has consistently acted as strong resistance, limiting further upward movement in gold prices. Historically, gold prices have repeatedly tested this level, but have failed to break through effectively due to insufficient bullish momentum. This has resulted in a large accumulation of trapped and profit-taking positions at this level, further strengthening the resistance. However, if the bulls can leverage positive macroeconomic support to sustain momentum and successfully overcome the key resistance level of $4,600, then gold prices will open up new upward potential. Based on the current ascending triangle pattern, once the $4,600 resistance is broken, the next theoretical target for gold prices would be around $4,900. This target calculation is based on the volume-price relationship and spatial expansion patterns of the ascending triangle pattern, and has strong technical reference value.
While the gold market is currently showing a clear upward trend, high volatility remains a typical characteristic of the precious metals market. Especially with gold prices approaching key resistance levels, the battle between bulls and bears may intensify further, and price fluctuations could widen accordingly. For investors planning to participate in gold derivatives trading, fully understanding the risk mechanisms of leveraged trading, setting reasonable stop-loss and take-profit points, and controlling position size are core prerequisites for reducing investment risk and achieving stable investment. Blindly chasing highs and lows should be avoided.
The path to $5,000
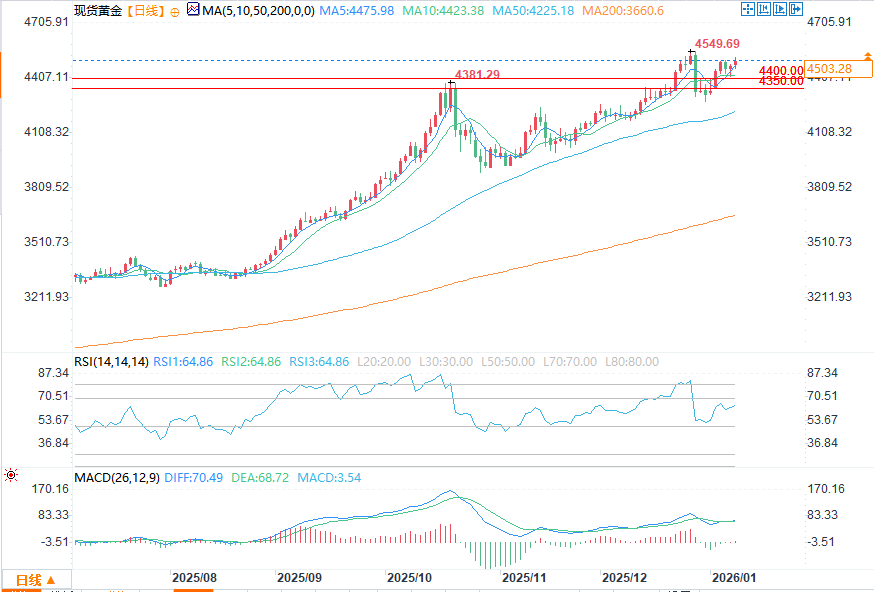
(Spot gold daily chart source: FX678)
From a long-term perspective, if gold prices successfully break through the previously mentioned target of $4,900, the next significant milestone will naturally point to the $5,000 mark. Considering the current macroeconomic environment and market momentum, this key level of $5,000 is expected to be reached sometime in 2026. However, we must also be aware that gold prices have accumulated substantial gains over the past few months, and bullish momentum has been significantly depleted, making continued unilateral upward movement in the short term difficult. Therefore, from the perspective of healthy market operation, a certain degree of back-and-forth fluctuations, range-bound consolidation, and momentum building in the short term may be a more sustainable trend. This consolidation can not only digest the pressure from previous profit-taking but also accumulate new bullish momentum for subsequent upward movement, preventing market bubbles caused by excessively rapid increases, thereby driving a more stable medium- to long-term upward trend in gold prices.
Of course, market trends are always uncertain. If gold prices fail to break through the upper resistance and instead fall back from the current level, then the area around $4,200 will become a stronger support level. The strength of this support level stems from two main factors: firstly, historically, $4,200 served as a significant consolidation platform during gold's previous upward trend, accumulating substantial buying interest; secondly, this area coincides with the 20-week and 60-week moving averages, and the support from these medium- to long-term technical indicators will further enhance the area's resilience, potentially attracting many medium- to long-term investors to buy on dips.
In recent years, central banks in both developed and emerging markets have been continuously increasing their gold reserves. This trend reflects the concerns of various countries about global economic uncertainty, geopolitical risks, and the credit risks of major reserve currencies. The continuous increase in central bank holdings has undoubtedly provided solid medium- to long-term support for gold prices and further strengthened gold's value storage attributes.
Gold Market Weekly Technical Analysis
Looking back at the gold market performance this trading week, gold prices showed a fluctuating upward trend after the start of the week. Although there were occasional pullbacks during the session, strong buying support pushed prices closer to the $4,500 psychological and technical resistance level that the market is closely watching. One of the core driving events of the week—the US non-farm payroll data—was officially released earlier. The data showed that key indicators such as the number of new jobs and the unemployment rate were weaker than the market's general expectations. This weak economic data directly strengthened market expectations for further easing monetary policy from the Federal Reserve, leading to a slight weakening of the US dollar index, which provided a direct boost to the rise in gold prices. This also allowed the market to continue the recent core operating logic of "weak economic data → increased risk aversion → stronger gold prices".
From a technical support perspective, the area around $4,400 is gradually forming a significant bottom support zone for gold prices in the short term. It's important to clarify that $4,400 is not an absolutely precise support level, but rather a support range with a strong buffer, its effective support extending roughly to around $4,350. This range has formed for two reasons: firstly, the market has repeatedly found support and rebounded in this area in the past, creating a clear consensus among investors; secondly, from the perspective of moving averages, the $4,350-$4,400 range coincides with the intersection of the 5-week and 10-week moving averages, further strengthening the stability of this range with multiple technical supports. As long as gold prices can consistently remain above this support range, the current medium-term upward trend will not be substantially broken.
In contrast to the solid support below, the $4,600 level has consistently acted as strong resistance, limiting further upward movement in gold prices. Historically, gold prices have repeatedly tested this level, but have failed to break through effectively due to insufficient bullish momentum. This has resulted in a large accumulation of trapped and profit-taking positions at this level, further strengthening the resistance. However, if the bulls can leverage positive macroeconomic support to sustain momentum and successfully overcome the key resistance level of $4,600, then gold prices will open up new upward potential. Based on the current ascending triangle pattern, once the $4,600 resistance is broken, the next theoretical target for gold prices would be around $4,900. This target calculation is based on the volume-price relationship and spatial expansion patterns of the ascending triangle pattern, and has strong technical reference value.
While the gold market is currently showing a clear upward trend, high volatility remains a typical characteristic of the precious metals market. Especially with gold prices approaching key resistance levels, the battle between bulls and bears may intensify further, and price fluctuations could widen accordingly. For investors planning to participate in gold derivatives trading, fully understanding the risk mechanisms of leveraged trading, setting reasonable stop-loss and take-profit points, and controlling position size are core prerequisites for reducing investment risk and achieving stable investment. Blindly chasing highs and lows should be avoided.
The path to $5,000
(Spot gold daily chart source: FX678)
From a long-term perspective, if gold prices successfully break through the previously mentioned target of $4,900, the next significant milestone will naturally point to the $5,000 mark. Considering the current macroeconomic environment and market momentum, this key level of $5,000 is expected to be reached sometime in 2026. However, we must also be aware that gold prices have accumulated substantial gains over the past few months, and bullish momentum has been significantly depleted, making continued unilateral upward movement in the short term difficult. Therefore, from the perspective of healthy market operation, a certain degree of back-and-forth fluctuations, range-bound consolidation, and momentum building in the short term may be a more sustainable trend. This consolidation can not only digest the pressure from previous profit-taking but also accumulate new bullish momentum for subsequent upward movement, preventing market bubbles caused by excessively rapid increases, thereby driving a more stable medium- to long-term upward trend in gold prices.
Of course, market trends are always uncertain. If gold prices fail to break through the upper resistance and instead fall back from the current level, then the area around $4,200 will become a stronger support level. The strength of this support level stems from two main factors: firstly, historically, $4,200 served as a significant consolidation platform during gold's previous upward trend, accumulating substantial buying interest; secondly, this area coincides with the 20-week and 60-week moving averages, and the support from these medium- to long-term technical indicators will further enhance the area's resilience, potentially attracting many medium- to long-term investors to buy on dips.
In recent years, central banks in both developed and emerging markets have been continuously increasing their gold reserves. This trend reflects the concerns of various countries about global economic uncertainty, geopolitical risks, and the credit risks of major reserve currencies. The continuous increase in central bank holdings has undoubtedly provided solid medium- to long-term support for gold prices and further strengthened gold's value storage attributes.
- Risk Warning and Disclaimer
- The market involves risk, and trading may not be suitable for all investors. This article is for reference only and does not constitute personal investment advice, nor does it take into account certain users’ specific investment objectives, financial situation, or other needs. Any investment decisions made based on this information are at your own risk.