Easing tensions with Iran and a stronger dollar led to a decline in gold prices.
2026-01-15 23:24:07
On Thursday (January 15), spot gold fell during the US session, marking its third consecutive day of lackluster performance, indicating that its upward momentum is weakening and it may be preparing for a short-term pullback, but the overall trend has not changed.

US Dollar Index Analysis
Rising US Treasury yields and a stronger dollar are weighing on dollar-denominated gold. Yields rose to 4.16% after finding support at the 50-day moving average of 4.126%, pushing the dollar index up to 99.129, its highest level since December 2nd. This also puts the dollar index on track to break through the resistance level of 99.384; a successful breakout could further limit gold's gains or trigger a deeper pullback.
Trump's focus on Greenland and his shift in stance on Iran impact safe-haven demand
Gold traders believe that Trump's focus on Greenland is one reason for potential support in gold prices, another factor being the situation in Iran. Trump's indication that he might suspend military action against Iran weakened market demand for gold as a safe haven after the Iranian government's violent crackdown on protests pushed gold prices to a record high of $4,642.97 on Wednesday.
Regarding Greenland, Trump said on Wednesday that the United States "needs Greenland" and cannot rely on Denmark to protect the island. As for Iran, he said he had been told that the killings in Iran's crackdown on protests were decreasing, suggesting the president would take a wait-and-see approach.
Expectations of interest rate cuts have kept bargain hunters active.
Despite waning momentum, investors are actually anticipating a short-term pullback. The market is not only supported by the 50-day moving average, which helps maintain a "buy on dips" strategy, but also by market expectations of at least two 25-basis-point rate cuts this year.
Low interest rate expectations are supporting the market and maintaining an upward trend, while temporary safe-haven demand is driving gold prices higher in the short term.
Technical Analysis
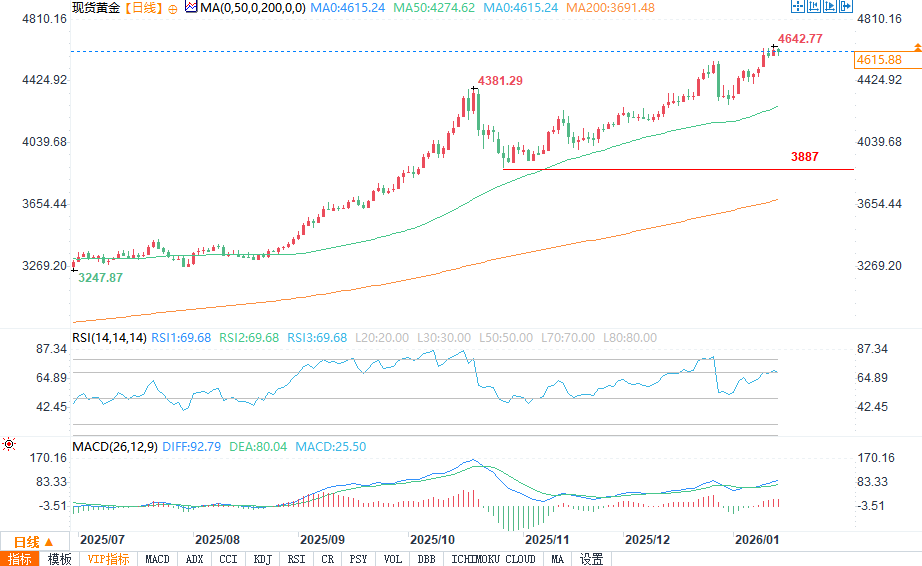
(Spot gold daily chart source: FX678)
From a technical perspective, based on the daily chart and the 50-day moving average, the main trend remains upward. A break above $4,642.97 would indicate a resumption of the uptrend, while a break below $4,274.02 would reverse the trend to downward. In the event of a short-term pullback, the 50% retracement level at $4,458.49 would be the first downside target and a buying opportunity. The main support and trend indicator is the 50-day moving average at $4,274.40.
Short-term outlook: A pullback is possible, but the uptrend remains intact.
Looking ahead, rising yields, a stronger dollar, and easing geopolitical concerns could weigh on gold prices, forcing a pullback to the key support level of $4,458.49. Since the main trend remains upward, buyers may view any pullback as a buying opportunity. This process could continue as long as the 50-day moving average support holds.
US Dollar Index Analysis
Rising US Treasury yields and a stronger dollar are weighing on dollar-denominated gold. Yields rose to 4.16% after finding support at the 50-day moving average of 4.126%, pushing the dollar index up to 99.129, its highest level since December 2nd. This also puts the dollar index on track to break through the resistance level of 99.384; a successful breakout could further limit gold's gains or trigger a deeper pullback.
Trump's focus on Greenland and his shift in stance on Iran impact safe-haven demand
Gold traders believe that Trump's focus on Greenland is one reason for potential support in gold prices, another factor being the situation in Iran. Trump's indication that he might suspend military action against Iran weakened market demand for gold as a safe haven after the Iranian government's violent crackdown on protests pushed gold prices to a record high of $4,642.97 on Wednesday.
Regarding Greenland, Trump said on Wednesday that the United States "needs Greenland" and cannot rely on Denmark to protect the island. As for Iran, he said he had been told that the killings in Iran's crackdown on protests were decreasing, suggesting the president would take a wait-and-see approach.
Expectations of interest rate cuts have kept bargain hunters active.
Despite waning momentum, investors are actually anticipating a short-term pullback. The market is not only supported by the 50-day moving average, which helps maintain a "buy on dips" strategy, but also by market expectations of at least two 25-basis-point rate cuts this year.
Low interest rate expectations are supporting the market and maintaining an upward trend, while temporary safe-haven demand is driving gold prices higher in the short term.
Technical Analysis
(Spot gold daily chart source: FX678)
From a technical perspective, based on the daily chart and the 50-day moving average, the main trend remains upward. A break above $4,642.97 would indicate a resumption of the uptrend, while a break below $4,274.02 would reverse the trend to downward. In the event of a short-term pullback, the 50% retracement level at $4,458.49 would be the first downside target and a buying opportunity. The main support and trend indicator is the 50-day moving average at $4,274.40.
Short-term outlook: A pullback is possible, but the uptrend remains intact.
Looking ahead, rising yields, a stronger dollar, and easing geopolitical concerns could weigh on gold prices, forcing a pullback to the key support level of $4,458.49. Since the main trend remains upward, buyers may view any pullback as a buying opportunity. This process could continue as long as the 50-day moving average support holds.
- Risk Warning and Disclaimer
- The market involves risk, and trading may not be suitable for all investors. This article is for reference only and does not constitute personal investment advice, nor does it take into account certain users’ specific investment objectives, financial situation, or other needs. Any investment decisions made based on this information are at your own risk.