Oil prices plummeted 4.6%! Is the market starting to deflate its bubble?
2026-01-15 21:31:00
On Thursday, January 15th, the international crude oil market experienced a sharp correction, with prices falling significantly. US crude oil was last quoted at $59.23 per barrel, a rapid decline from the previous day's high, with an intraday drop exceeding 4.6% at one point. Brent crude also weakened, closing at $63.70 per barrel, a daily drop of 2.8%. Previously, oil prices had surged to a high of $66.79 per barrel due to tensions in the Middle East, but as geopolitical risk premiums quickly subsided, the market entered a "bubble-bursting" phase.

The core driver of this round of decline is the significant easing of geopolitical tensions. The White House has signaled relative restraint regarding the situation in Iran, stating that recent violence has subsided and suggesting that a large-scale military conflict is unlikely in the short term. Since the Middle East is a key route for global oil transportation, any potential conflict would quickly push up the "risk premium" in oil prices. In the past few weeks, this premium has accounted for a significant portion of the oil price increase. Once the market judges that the probability of the "worst-case scenario" has decreased, prices will quickly retrace the previously overvalued portion, resulting in a sharp decline.
This "emotion-driven—rapid reversal" pattern is not uncommon in commodity markets, especially in commodities like crude oil that possess both physical and financial attributes. When tensions escalate, funds flock to safe-haven assets; once the storm has passed, profit-taking quickly leads to sharp price fluctuations. This correction is a prime example of this logic—not a sudden change in fundamentals, but rather a fundamental shift in the market's pricing of the "war narrative."
In addition to easing geopolitical tensions, fundamental data is also putting downward pressure on oil prices. The latest data released by the U.S. Energy Information Administration (EIA) shows that U.S. crude oil and gasoline inventories rose more than expected last week. Rising inventories typically indicate a looser short-term supply-demand relationship: either due to insufficient refinery operating rates, weak end-user demand, or increased imports leading to ample supply. In any case, this weakens expectations of tightness in the spot market, thereby suppressing upward momentum for oil prices.
More notably, marginal changes are emerging on the supply side. Venezuela has begun to gradually resume crude oil exports, and there are signs of some easing in production cuts. Although its production recovery is not yet sustainable, it has already created a disturbance in market expectations—the increased possibility of a "potential supply return" has weakened the bulls' motivation to continue pushing up oil prices. At the same time, news has revealed that a $500 million Venezuelan oil deal has been finalized, further reinforcing market expectations of a "supply recovery."
Furthermore, the EU lowered the price ceiling for Russian crude oil to $44.10 per barrel. While this will primarily impact trade flows and grade price differentials in the short term, if implemented smoothly, it could provide the global market with additional low-priced resources. These factors, coupled with existing inventory pressures in the US, have shifted market focus from concerns about supply disruptions to a focus on physical market balance, thus weakening the basis for price increases driven solely by geopolitical panic.
On the demand side, things remained stable but lacked bright spots. The Organization of Major Oil Producers (OPCW) maintained its steady forecast for demand growth over the next few years, noting that the global crude oil market will be in a "near-balanced" state by 2026. This assessment is neutral to cautious: it indicates that there will be no severe shortage, but it also does not support a prolonged period of high premiums. Without new demand drivers or structural gaps, oil prices are unlikely to strengthen independently of fundamentals.
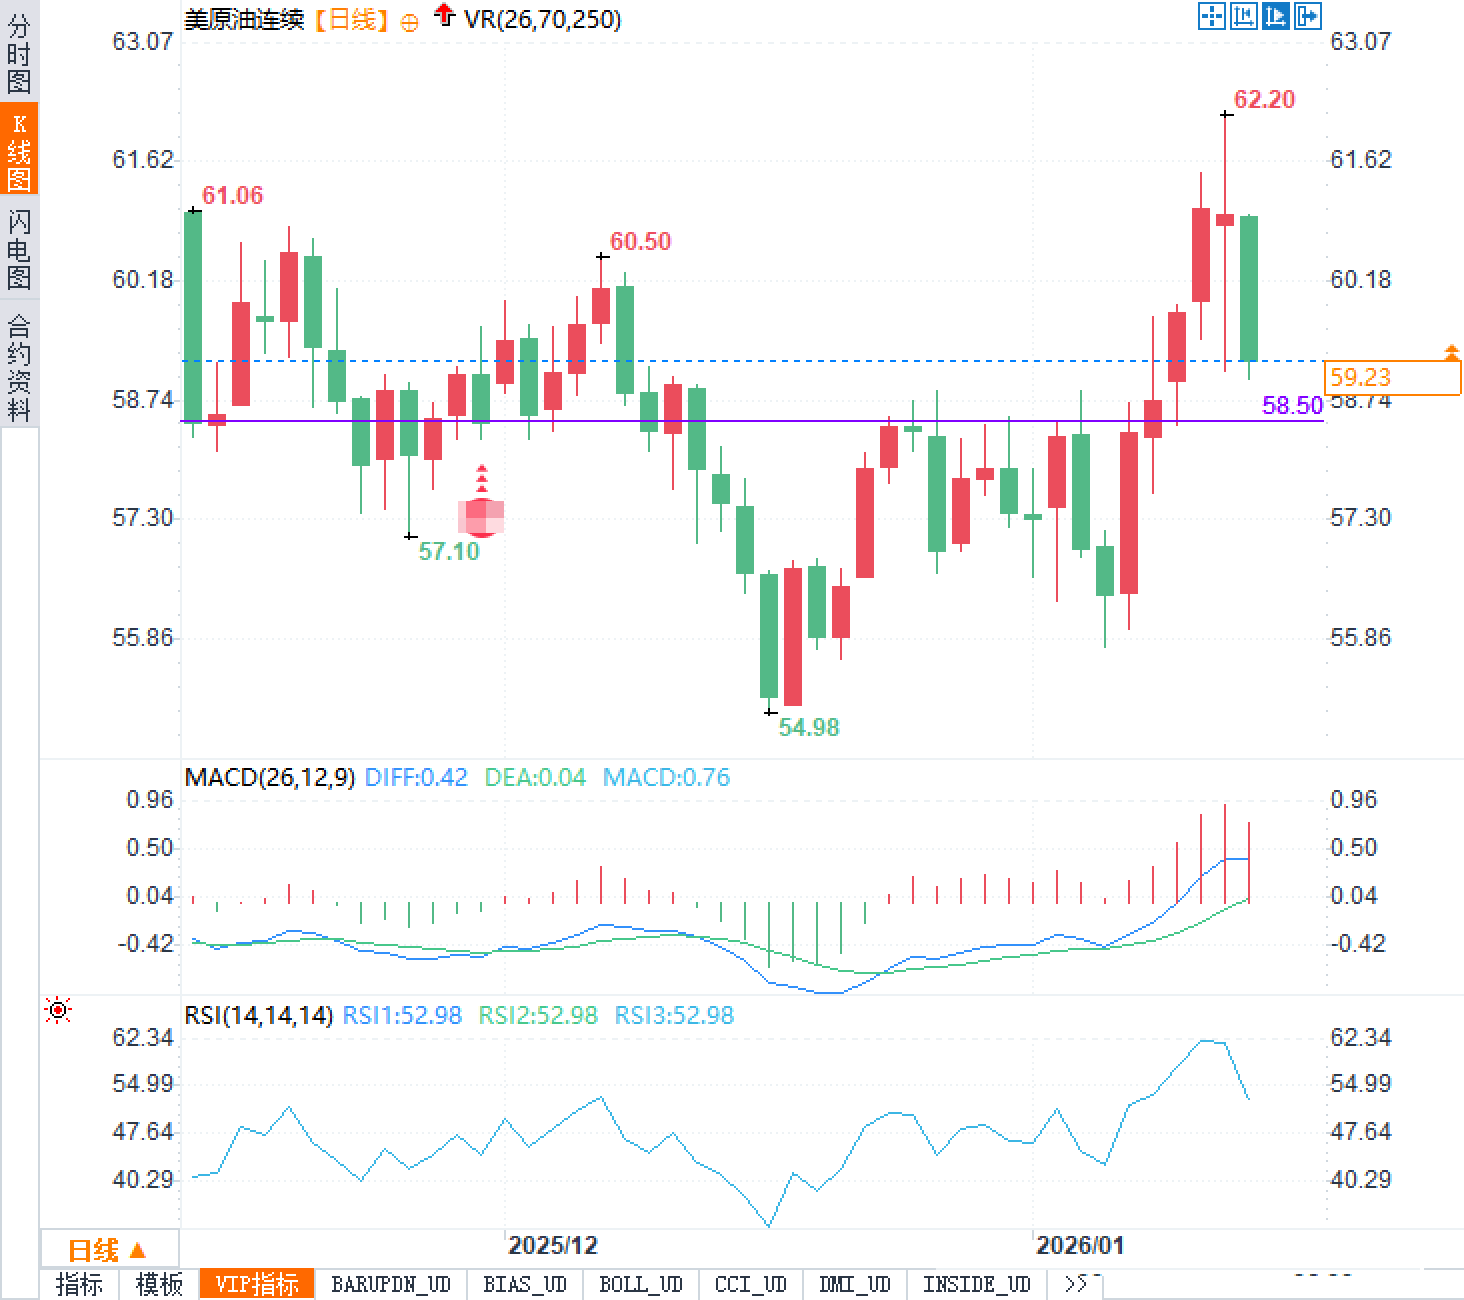
From a technical chart perspective, US crude oil previously surged to $62.20 before falling back, and is currently at $59.23, which is within the previous densely traded area. The area around $58.50 below has strong support significance, and once it breaks down, it may trigger further technical selling; on the other hand, it needs to regain a foothold above $60.20 and attempt to recover the previous high in order to restart the upward trend. The MACD indicator shows that the DIFF is 0.42, the DEA is 0.04, and the MACD histogram is 0.76, indicating that the momentum is still slightly positive but tending to converge; the RSI (14) is about 52.98, which is in the neutral zone, indicating that the market has shifted from a "slightly strong" state to a "balanced" state, which is consistent with the characteristics of "consolidation after premium retracement".
In summary, this oil price correction is not due to a fundamental deterioration, but rather a concentrated adjustment to the excessively accumulated geopolitical risk premium. The market's focus will now be on three key variables: first, whether the situation in Iran will escalate again, potentially triggering new supply concerns; second, whether US crude oil inventories and refined product demand will improve, verifying the resilience of the consumer side; and third, whether the interest rate path will shift due to economic data or policy statements, thereby affecting global funding costs and commodity allocation preferences.
The core driver of this round of decline is the significant easing of geopolitical tensions. The White House has signaled relative restraint regarding the situation in Iran, stating that recent violence has subsided and suggesting that a large-scale military conflict is unlikely in the short term. Since the Middle East is a key route for global oil transportation, any potential conflict would quickly push up the "risk premium" in oil prices. In the past few weeks, this premium has accounted for a significant portion of the oil price increase. Once the market judges that the probability of the "worst-case scenario" has decreased, prices will quickly retrace the previously overvalued portion, resulting in a sharp decline.
This "emotion-driven—rapid reversal" pattern is not uncommon in commodity markets, especially in commodities like crude oil that possess both physical and financial attributes. When tensions escalate, funds flock to safe-haven assets; once the storm has passed, profit-taking quickly leads to sharp price fluctuations. This correction is a prime example of this logic—not a sudden change in fundamentals, but rather a fundamental shift in the market's pricing of the "war narrative."
Supply and demand realities are dragging down the economy, with both inventory and supply pressures looming.
In addition to easing geopolitical tensions, fundamental data is also putting downward pressure on oil prices. The latest data released by the U.S. Energy Information Administration (EIA) shows that U.S. crude oil and gasoline inventories rose more than expected last week. Rising inventories typically indicate a looser short-term supply-demand relationship: either due to insufficient refinery operating rates, weak end-user demand, or increased imports leading to ample supply. In any case, this weakens expectations of tightness in the spot market, thereby suppressing upward momentum for oil prices.
More notably, marginal changes are emerging on the supply side. Venezuela has begun to gradually resume crude oil exports, and there are signs of some easing in production cuts. Although its production recovery is not yet sustainable, it has already created a disturbance in market expectations—the increased possibility of a "potential supply return" has weakened the bulls' motivation to continue pushing up oil prices. At the same time, news has revealed that a $500 million Venezuelan oil deal has been finalized, further reinforcing market expectations of a "supply recovery."
Furthermore, the EU lowered the price ceiling for Russian crude oil to $44.10 per barrel. While this will primarily impact trade flows and grade price differentials in the short term, if implemented smoothly, it could provide the global market with additional low-priced resources. These factors, coupled with existing inventory pressures in the US, have shifted market focus from concerns about supply disruptions to a focus on physical market balance, thus weakening the basis for price increases driven solely by geopolitical panic.
On the demand side, things remained stable but lacked bright spots. The Organization of Major Oil Producers (OPCW) maintained its steady forecast for demand growth over the next few years, noting that the global crude oil market will be in a "near-balanced" state by 2026. This assessment is neutral to cautious: it indicates that there will be no severe shortage, but it also does not support a prolonged period of high premiums. Without new demand drivers or structural gaps, oil prices are unlikely to strengthen independently of fundamentals.
Macroeconomic shifts and technical structure converge, suggesting a continuation of the oscillating pattern.
From a technical chart perspective, US crude oil previously surged to $62.20 before falling back, and is currently at $59.23, which is within the previous densely traded area. The area around $58.50 below has strong support significance, and once it breaks down, it may trigger further technical selling; on the other hand, it needs to regain a foothold above $60.20 and attempt to recover the previous high in order to restart the upward trend. The MACD indicator shows that the DIFF is 0.42, the DEA is 0.04, and the MACD histogram is 0.76, indicating that the momentum is still slightly positive but tending to converge; the RSI (14) is about 52.98, which is in the neutral zone, indicating that the market has shifted from a "slightly strong" state to a "balanced" state, which is consistent with the characteristics of "consolidation after premium retracement".
In summary, this oil price correction is not due to a fundamental deterioration, but rather a concentrated adjustment to the excessively accumulated geopolitical risk premium. The market's focus will now be on three key variables: first, whether the situation in Iran will escalate again, potentially triggering new supply concerns; second, whether US crude oil inventories and refined product demand will improve, verifying the resilience of the consumer side; and third, whether the interest rate path will shift due to economic data or policy statements, thereby affecting global funding costs and commodity allocation preferences.
- Risk Warning and Disclaimer
- The market involves risk, and trading may not be suitable for all investors. This article is for reference only and does not constitute personal investment advice, nor does it take into account certain users’ specific investment objectives, financial situation, or other needs. Any investment decisions made based on this information are at your own risk.