Initial jobless claims data reinforced expectations that the Federal Reserve would maintain interest rates, supporting a rebound in the US dollar index.
2026-01-16 13:58:30
The dollar index retreated modestly in Asian trading on Friday after a slight gain in the previous session, currently trading around 99.30. Investors are awaiting US December industrial production data and speeches from Federal Reserve officials for new directional guidance.
Despite a slight pullback during the session, the US dollar remained relatively strong overall. Thursday's employment data was a key factor supporting the dollar.
Data from the U.S. Department of Labor shows that initial jobless claims unexpectedly fell to 198,000 in the week ending January 10, significantly lower than the market expectation of 215,000 and a further decline from the revised figure of 207,000 in the previous week.
Data shows that despite prolonged high interest rates, the US labor market remains resilient, with limited pressure on businesses to lay off employees. Pricing in the interest rate futures market further confirms this assessment.
According to the CME FedWatch tool, the probability of the Federal Reserve keeping interest rates unchanged at its January 27-28 meeting has risen to around 95%, and investors' expectations for the next rate cut have been pushed back to June.
Strong employment and sticky inflation expectations have jointly boosted demand for the US dollar. In terms of market sentiment, a temporary easing of external uncertainties has also improved risk appetite, with capital flows favoring dollar assets, providing support for the dollar index at its high levels.
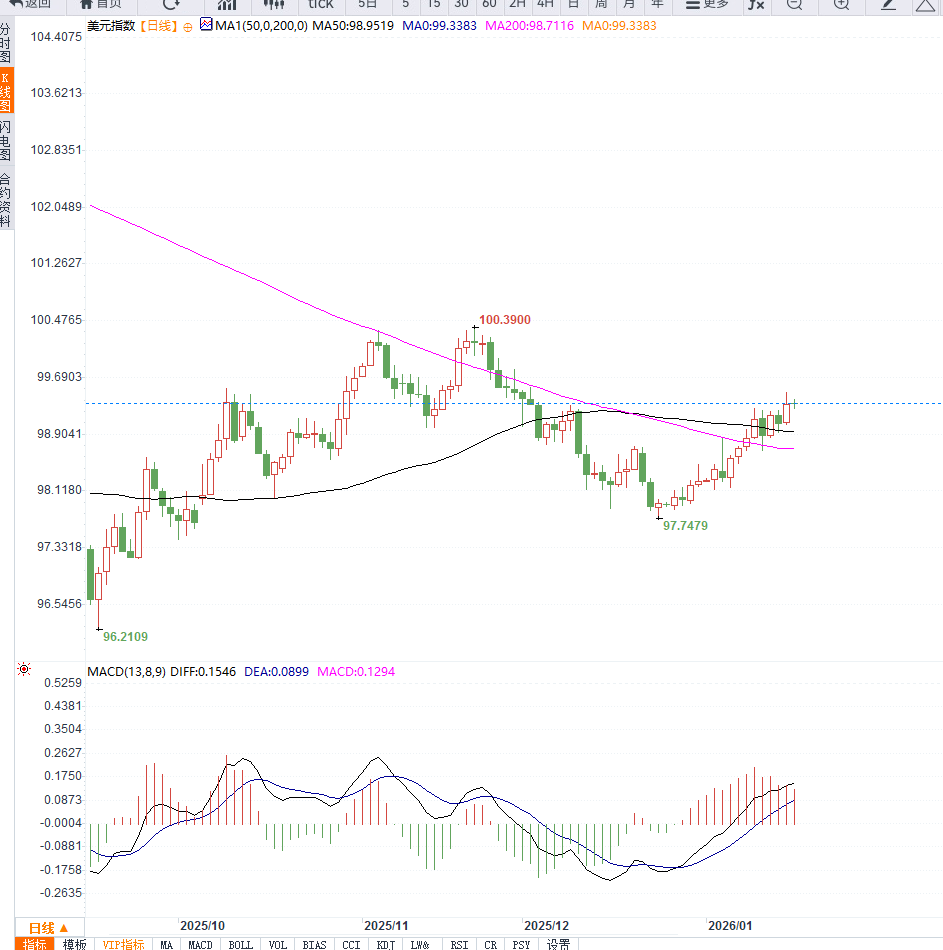
From the daily chart, the US dollar index has held steady above 98.80 after a previous rebound and has gradually moved up to around 99.30. Overall, it remains in a bullish trading channel.
The price has remained above the 5-day and 10-day moving averages for several consecutive days, indicating that the short-term moving average system continues to rise and the trend has not yet been broken. In terms of technical indicators, the MACD fast and slow lines are above the zero line and maintaining a moderate expansion; although the momentum of the red bars has slowed somewhat, there are still no obvious signs of a bearish reversal.
The RSI is hovering around 60, indicating a slightly bullish but not overheated market. The Bollinger Band's middle line continues to rise, with the price trading close to the upper band, reflecting that the bulls still control the market. At key levels, 99.50-99.70 constitutes significant short-term resistance; a successful breakout could see the index challenge the 100 psychological level.
Support levels are located at 98.80 and 98.20. As long as this area holds, the daily chart will maintain a slightly bullish consolidation pattern. Overall, the chart is considered a consolidation phase within an uptrend, and pullbacks are more likely to be seen as technical accumulation.
Editor's Note:
The core driver of the US dollar index has shifted from "interest rate cut expectation trade" to "high interest rate continuation trade." Unexpectedly strong employment data has led the market to reprice the Fed's policy path, and technical indicators also show that the bullish structure remains intact.
However, as it approaches the 100 mark, further upward movement requires stronger data catalysts. If industrial output and subsequent inflation indicators continue to confirm economic resilience, the dollar is expected to open up new upside potential; otherwise, it may return to the 98-99 range and fluctuate repeatedly.
Despite a slight pullback during the session, the US dollar remained relatively strong overall. Thursday's employment data was a key factor supporting the dollar.
Data from the U.S. Department of Labor shows that initial jobless claims unexpectedly fell to 198,000 in the week ending January 10, significantly lower than the market expectation of 215,000 and a further decline from the revised figure of 207,000 in the previous week.
Data shows that despite prolonged high interest rates, the US labor market remains resilient, with limited pressure on businesses to lay off employees. Pricing in the interest rate futures market further confirms this assessment.
According to the CME FedWatch tool, the probability of the Federal Reserve keeping interest rates unchanged at its January 27-28 meeting has risen to around 95%, and investors' expectations for the next rate cut have been pushed back to June.
Strong employment and sticky inflation expectations have jointly boosted demand for the US dollar. In terms of market sentiment, a temporary easing of external uncertainties has also improved risk appetite, with capital flows favoring dollar assets, providing support for the dollar index at its high levels.
From the daily chart, the US dollar index has held steady above 98.80 after a previous rebound and has gradually moved up to around 99.30. Overall, it remains in a bullish trading channel.
The price has remained above the 5-day and 10-day moving averages for several consecutive days, indicating that the short-term moving average system continues to rise and the trend has not yet been broken. In terms of technical indicators, the MACD fast and slow lines are above the zero line and maintaining a moderate expansion; although the momentum of the red bars has slowed somewhat, there are still no obvious signs of a bearish reversal.
The RSI is hovering around 60, indicating a slightly bullish but not overheated market. The Bollinger Band's middle line continues to rise, with the price trading close to the upper band, reflecting that the bulls still control the market. At key levels, 99.50-99.70 constitutes significant short-term resistance; a successful breakout could see the index challenge the 100 psychological level.
Support levels are located at 98.80 and 98.20. As long as this area holds, the daily chart will maintain a slightly bullish consolidation pattern. Overall, the chart is considered a consolidation phase within an uptrend, and pullbacks are more likely to be seen as technical accumulation.
Editor's Note:
The core driver of the US dollar index has shifted from "interest rate cut expectation trade" to "high interest rate continuation trade." Unexpectedly strong employment data has led the market to reprice the Fed's policy path, and technical indicators also show that the bullish structure remains intact.
However, as it approaches the 100 mark, further upward movement requires stronger data catalysts. If industrial output and subsequent inflation indicators continue to confirm economic resilience, the dollar is expected to open up new upside potential; otherwise, it may return to the 98-99 range and fluctuate repeatedly.
- Risk Warning and Disclaimer
- The market involves risk, and trading may not be suitable for all investors. This article is for reference only and does not constitute personal investment advice, nor does it take into account certain users’ specific investment objectives, financial situation, or other needs. Any investment decisions made based on this information are at your own risk.