Gold Price Forecast: Renewed Trade Uncertainty Boosts Gold Prices
2026-01-20 01:45:31
On Monday (January 19th) during the US trading session, gold showed a clear bullish trend from the start of the week, rising over 1.5% and approaching its all-time high of around $4,700 per troy ounce. The renewed strength in short-term demand stems from two factors: the US government's recent statements considering reinstating tariffs on Europe, and the ongoing dispute over the future status of Greenland. These two factors have combined to increase geopolitical uncertainty. This backdrop has further amplified risk aversion across the market, highlighting gold's safe-haven asset status. Under these circumstances, spot gold against the US dollar is likely to continue facing buying support in the coming trading sessions.

Trade tensions escalate
Starting January 17, US President Trump announced plans to impose a 10% tariff on imports from eight European countries, with the measure scheduled to take effect on February 1. President Trump stated that this decision stemmed from opposition from several European countries to his plan to acquire or control Greenland—which he considers strategically vital to the United States from a geopolitical and geostrategic perspective. The US also warned that if no agreement is reached with the EU, the tariff rate will increase to 25% starting in June.
Europe responded swiftly, not only rejecting the US tariff threats outright and stating that such measures were unacceptable, but also reiterating that Greenland is not a tradable commodity. Furthermore, European officials warned that the US actions could not only provoke trade retaliation but also damage diplomatic relations between the two economies, which maintain close trade and military ties. To date, no substantial progress has been made in easing the conflict, and Europe has called for a special meeting, causing market confidence to become increasingly uncertain.
The current market environment has created a great deal of uncertainty. The market generally assesses that if Europe takes strong countermeasures, it could negatively impact US export performance, thus putting pressure on the dollar in the short term. This trend is already reflected in the US Dollar Index (DXY): this index measures the strength of the dollar against a basket of major currencies, and has now fallen from 99.4 to around 99.05, signaling a renewed weakening of the dollar.
Against this backdrop, escalating diplomatic and trade tensions appear to be putting downward pressure on the dollar, while gold is beginning to absorb some of the funds flowing out of the foreign exchange market. As long as geopolitical risks remain high and the dollar continues to weaken, gold, as a hedging asset, is expected to continue to play its safe-haven role, supported by a temporary decline in market confidence in the dollar, until the direction of trade negotiations gradually becomes clearer.
Is market confidence facing another test?
Gold typically benefits during periods of weakening market confidence, and this trend is beginning to emerge in key indicators. CNN's Fear & Greed Index is currently around 62 points, still within the "greed" zone, but the index curve has shown significant signs of flattening, indicating that short-term market hesitation is intensifying again.
If this gradual weakening of market confidence becomes more pronounced in the coming trading sessions, the overall market environment may shift towards a more risk-averse model, thereby driving up demand for safe-haven assets. In this scenario, gold's importance as a store of value will become more apparent, and it is expected to continue attracting buying support in the short term.
Gold Technical Outlook
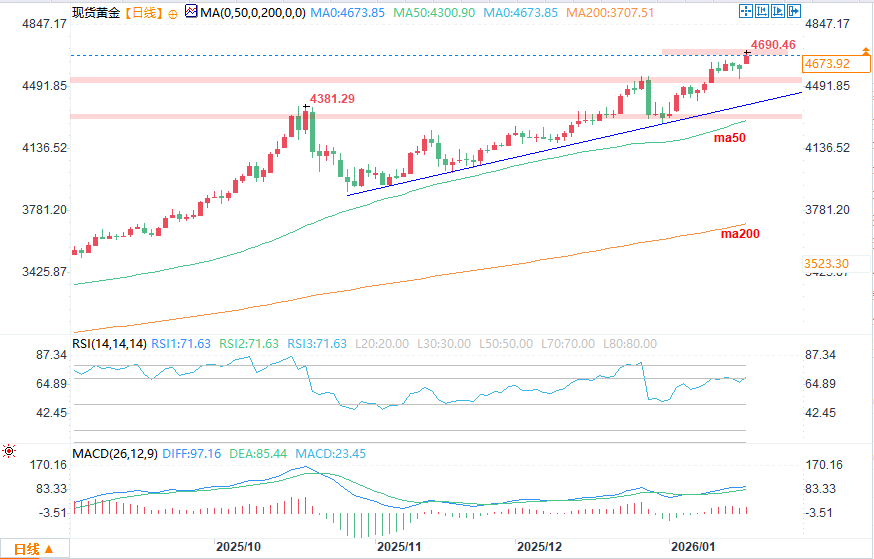
(Spot gold daily chart source: FX678)
The dominant trend is bullish: Over the past few months, gold has maintained a steady bullish pattern, characterized by consistently higher highs and higher lows, leading to numerous record highs. Currently, there are no clear technical signals indicating an impending trend reversal. However, it's worth noting that as prices approach key psychological levels, gold may enter a consolidation phase or experience a technical pullback before resuming its upward trend.
Relative Strength Index (RSI): This indicator is currently in the overbought zone around 70, and a bearish divergence pattern has emerged—specifically, while gold prices continue to reach new highs, the highs of the RSI are constantly declining. This pattern typically indicates that short-term buying momentum may be weakening, and a technical correction in gold prices is possible.
Moving Average Convergence Divergence (MACD): When the MACD histogram fluctuates around the zero line, it reflects a temporary balance between the forces of buyers and sellers in the market. This pattern often appears during consolidation phases or before pullbacks, and the market may subsequently choose a new direction.
Key focus price level
$4,700 – Key Resistance Level: This price level is a crucial psychological barrier for the market, especially given the lack of historical price references above it. If gold prices can hold above this level, it will further strengthen bullish sentiment and open up room for a new high in the short term.
$4538 – A recent resistance level that has now become an important technical reference point: This price level was a historical high and has now become an important technical reference point. If gold prices pull back, this level may become a short-term support point, and whether it holds or fails will help determine whether the current bullish pattern remains firm.
$4333 – Key Support Level: This price level coincides with the 50-period simple moving average. A pullback to this range would test the current bullish structure; a decisive break below this support level could lead to a more significant pullback.
Trade tensions escalate
Starting January 17, US President Trump announced plans to impose a 10% tariff on imports from eight European countries, with the measure scheduled to take effect on February 1. President Trump stated that this decision stemmed from opposition from several European countries to his plan to acquire or control Greenland—which he considers strategically vital to the United States from a geopolitical and geostrategic perspective. The US also warned that if no agreement is reached with the EU, the tariff rate will increase to 25% starting in June.
Europe responded swiftly, not only rejecting the US tariff threats outright and stating that such measures were unacceptable, but also reiterating that Greenland is not a tradable commodity. Furthermore, European officials warned that the US actions could not only provoke trade retaliation but also damage diplomatic relations between the two economies, which maintain close trade and military ties. To date, no substantial progress has been made in easing the conflict, and Europe has called for a special meeting, causing market confidence to become increasingly uncertain.
The current market environment has created a great deal of uncertainty. The market generally assesses that if Europe takes strong countermeasures, it could negatively impact US export performance, thus putting pressure on the dollar in the short term. This trend is already reflected in the US Dollar Index (DXY): this index measures the strength of the dollar against a basket of major currencies, and has now fallen from 99.4 to around 99.05, signaling a renewed weakening of the dollar.
Against this backdrop, escalating diplomatic and trade tensions appear to be putting downward pressure on the dollar, while gold is beginning to absorb some of the funds flowing out of the foreign exchange market. As long as geopolitical risks remain high and the dollar continues to weaken, gold, as a hedging asset, is expected to continue to play its safe-haven role, supported by a temporary decline in market confidence in the dollar, until the direction of trade negotiations gradually becomes clearer.
Is market confidence facing another test?
Gold typically benefits during periods of weakening market confidence, and this trend is beginning to emerge in key indicators. CNN's Fear & Greed Index is currently around 62 points, still within the "greed" zone, but the index curve has shown significant signs of flattening, indicating that short-term market hesitation is intensifying again.
If this gradual weakening of market confidence becomes more pronounced in the coming trading sessions, the overall market environment may shift towards a more risk-averse model, thereby driving up demand for safe-haven assets. In this scenario, gold's importance as a store of value will become more apparent, and it is expected to continue attracting buying support in the short term.
Gold Technical Outlook
(Spot gold daily chart source: FX678)
The dominant trend is bullish: Over the past few months, gold has maintained a steady bullish pattern, characterized by consistently higher highs and higher lows, leading to numerous record highs. Currently, there are no clear technical signals indicating an impending trend reversal. However, it's worth noting that as prices approach key psychological levels, gold may enter a consolidation phase or experience a technical pullback before resuming its upward trend.
Relative Strength Index (RSI): This indicator is currently in the overbought zone around 70, and a bearish divergence pattern has emerged—specifically, while gold prices continue to reach new highs, the highs of the RSI are constantly declining. This pattern typically indicates that short-term buying momentum may be weakening, and a technical correction in gold prices is possible.
Moving Average Convergence Divergence (MACD): When the MACD histogram fluctuates around the zero line, it reflects a temporary balance between the forces of buyers and sellers in the market. This pattern often appears during consolidation phases or before pullbacks, and the market may subsequently choose a new direction.
Key focus price level
$4,700 – Key Resistance Level: This price level is a crucial psychological barrier for the market, especially given the lack of historical price references above it. If gold prices can hold above this level, it will further strengthen bullish sentiment and open up room for a new high in the short term.
$4538 – A recent resistance level that has now become an important technical reference point: This price level was a historical high and has now become an important technical reference point. If gold prices pull back, this level may become a short-term support point, and whether it holds or fails will help determine whether the current bullish pattern remains firm.
$4333 – Key Support Level: This price level coincides with the 50-period simple moving average. A pullback to this range would test the current bullish structure; a decisive break below this support level could lead to a more significant pullback.
- Risk Warning and Disclaimer
- The market involves risk, and trading may not be suitable for all investors. This article is for reference only and does not constitute personal investment advice, nor does it take into account certain users’ specific investment objectives, financial situation, or other needs. Any investment decisions made based on this information are at your own risk.