Silver surges past $94! Is the bulls about to enter an acceleration phase?
2026-01-19 21:43:13
On Monday (January 19), spot silver continued its strong upward trend, trading around $93.40 during the North American session. On the daily chart, after the bulls pushed the price to a historical high near $94.099, the market entered a period of high-level consolidation, and the divergence between short-term funds regarding "continuing to accelerate the upward momentum" and "digesting the market first" began to become apparent.
The core driver of today's surge is the macroeconomic repricing effect caused by renewed tariff uncertainty. Related comments suggest that if no agreement is reached on the Greenland issue, the US may impose a 10% tariff on some European countries, including the UK, France, and Germany, starting February 1st; if no further agreement is reached, the tariff may be raised to 25% from June 1st. This kind of "tariff path forward, conditions later" approach can easily raise market concerns in the short term about the coexistence of sticky inflation and pressure on growth, thereby strengthening the defensive attributes of precious metals.
From a trading perspective, silver possesses both precious metal and industrial attributes. When macroeconomic uncertainty intensifies, demand for safe-haven assets and inflation hedging initially drives up precious metal premiums. However, when policy expectations fluctuate, silver, due to its higher volatility, experiences more dramatic pullbacks and subsequent rallies. The market is currently also watching for a possible recurrence of the so-called "TACO trade" (an abbreviation for "Trump Always Chickens Out"): strong rhetoric initially leads to a rise in risk premiums, followed by a price retracing if the tone softens or there are signs of easing. Going forward, the key to whether silver can establish a new consolidation pattern from its historical highs lies not in a single data point, but in whether tariff-related statements continue to escalate or whether clear signs of de-escalation emerge.
On the data front, in the short term, attention should be paid to the US ADP employment data, US initial jobless claims, and the preliminary US composite PMI. Stronger-than-expected employment and economic data may push up interest rate expectations and suppress the sentiment premium for precious metals; weaker-than-expected data will more likely reinforce the "slowing growth" narrative, which would benefit defensive buying in silver.
From the daily candlestick chart, spot silver is in a clear upward trend, with recent peaks and troughs rising consecutively, exhibiting a typical trend continuation structure. Currently, it's trading within a historical high range at $93.40, with $94.099 forming the most important resistance level in the near term. This area represents a convergence of previous high resistance and psychological barriers. If it breaks through and holds above this level with significant volume, the price is likely to enter an "acceleration phase," with volatility increasing accordingly. There are two key support levels to watch on the downside: firstly, the short-term support/resistance level around $91, which represents the first pullback support zone after an upward move; secondly, the more defined medium-term support line at $85. If the pullback widens, $85 will determine whether the trend can maintain its strong "pullback without breaking the structure" pattern.
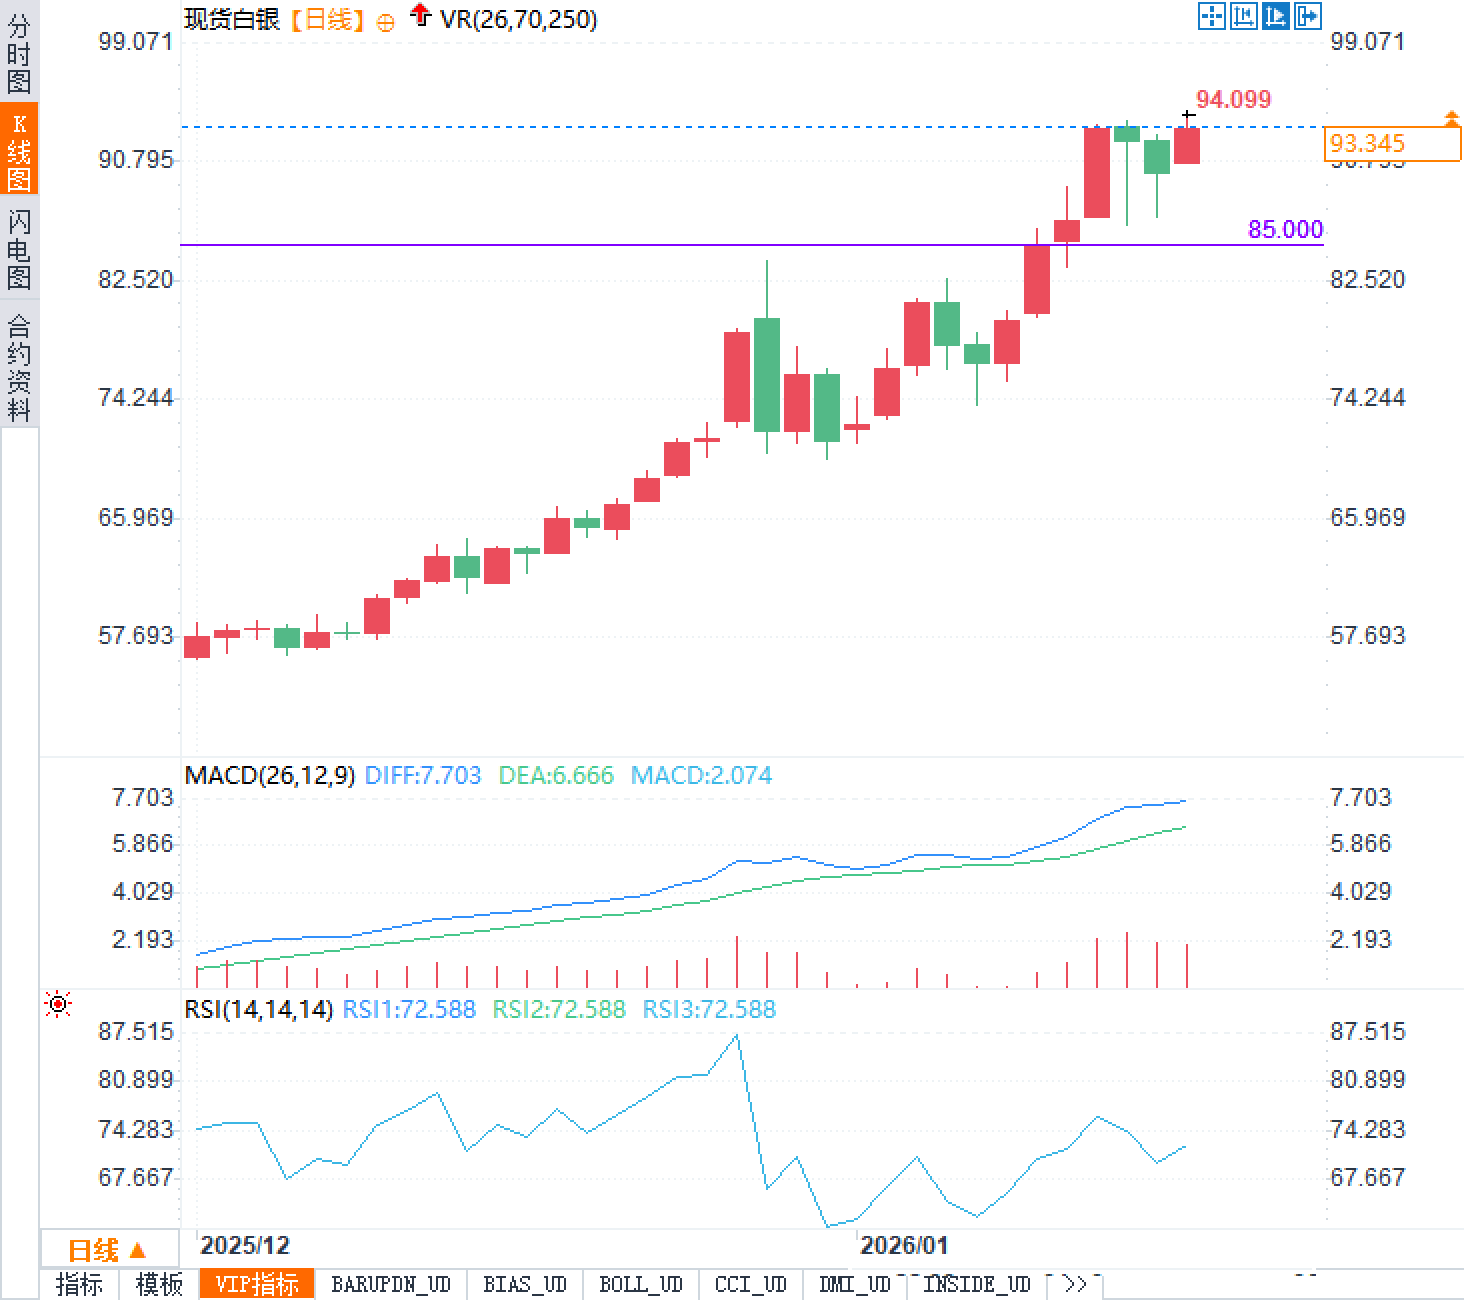
In terms of indicators, the MACD shows that the DIFF is 7.703, the DEA is 6.666, and the MACD histogram is 2.074, which are above the zero axis and the histogram is positive, indicating that the medium-term momentum is still relatively strong and the trend trading funds have not withdrawn significantly. However, it should be noted that if the price rises but the histogram weakens while the indicators continue to expand at high levels, a momentum divergence signal is likely to appear. At that time, the speed of the pullback at high levels will often be faster than the market expects. The RSI (14) is 72.588, which has entered the overbought zone. This does not mean that the top has been reached immediately, but it means that the safety margin of the funds chasing the rise has decreased. The more common evolution path is: either the high-level sideways digestion will cause the RSI to become dull and fall back; or the pullback will first fall back to the key support level to complete the "pullback confirmation" and then choose a new direction. In summary, the current situation is more like a high-level consolidation phase after the upward trend. Traders should pay attention to the validity of the breakout at $94.099 and the defensive quality of the two support levels at $91 and $85.
The key short-term sentiment terms are "defense and uncertainty premium." When tariff-related statements are inconsistent, with clear timings but uncertain conditions, the market typically prices in the tail-end scenario with a higher risk premium, thus benefiting precious metals. Meanwhile, silver exhibits greater sentiment elasticity: once signs of easing emerge, early buying and short-term leveraged funds are prone to concentrated profit-taking, leading to a rapid pullback; conversely, if statements continue to escalate, short covering and trend-following funds will push prices upward again.
Therefore, the market rhythm in the coming days may resemble "news-driven pulse fluctuations": positive news will push prices up, while a lack of new catalysts will lead to high-level consolidation, with data and news jointly determining the next breakout or pullback. For traders, in this environment, it is more important to identify "post-breakout support" and "post-pullback retests" rather than simply chasing the price fluctuations of a single candlestick.
Fundamentals
The core driver of today's surge is the macroeconomic repricing effect caused by renewed tariff uncertainty. Related comments suggest that if no agreement is reached on the Greenland issue, the US may impose a 10% tariff on some European countries, including the UK, France, and Germany, starting February 1st; if no further agreement is reached, the tariff may be raised to 25% from June 1st. This kind of "tariff path forward, conditions later" approach can easily raise market concerns in the short term about the coexistence of sticky inflation and pressure on growth, thereby strengthening the defensive attributes of precious metals.
From a trading perspective, silver possesses both precious metal and industrial attributes. When macroeconomic uncertainty intensifies, demand for safe-haven assets and inflation hedging initially drives up precious metal premiums. However, when policy expectations fluctuate, silver, due to its higher volatility, experiences more dramatic pullbacks and subsequent rallies. The market is currently also watching for a possible recurrence of the so-called "TACO trade" (an abbreviation for "Trump Always Chickens Out"): strong rhetoric initially leads to a rise in risk premiums, followed by a price retracing if the tone softens or there are signs of easing. Going forward, the key to whether silver can establish a new consolidation pattern from its historical highs lies not in a single data point, but in whether tariff-related statements continue to escalate or whether clear signs of de-escalation emerge.
On the data front, in the short term, attention should be paid to the US ADP employment data, US initial jobless claims, and the preliminary US composite PMI. Stronger-than-expected employment and economic data may push up interest rate expectations and suppress the sentiment premium for precious metals; weaker-than-expected data will more likely reinforce the "slowing growth" narrative, which would benefit defensive buying in silver.
Technical aspects:
From the daily candlestick chart, spot silver is in a clear upward trend, with recent peaks and troughs rising consecutively, exhibiting a typical trend continuation structure. Currently, it's trading within a historical high range at $93.40, with $94.099 forming the most important resistance level in the near term. This area represents a convergence of previous high resistance and psychological barriers. If it breaks through and holds above this level with significant volume, the price is likely to enter an "acceleration phase," with volatility increasing accordingly. There are two key support levels to watch on the downside: firstly, the short-term support/resistance level around $91, which represents the first pullback support zone after an upward move; secondly, the more defined medium-term support line at $85. If the pullback widens, $85 will determine whether the trend can maintain its strong "pullback without breaking the structure" pattern.
In terms of indicators, the MACD shows that the DIFF is 7.703, the DEA is 6.666, and the MACD histogram is 2.074, which are above the zero axis and the histogram is positive, indicating that the medium-term momentum is still relatively strong and the trend trading funds have not withdrawn significantly. However, it should be noted that if the price rises but the histogram weakens while the indicators continue to expand at high levels, a momentum divergence signal is likely to appear. At that time, the speed of the pullback at high levels will often be faster than the market expects. The RSI (14) is 72.588, which has entered the overbought zone. This does not mean that the top has been reached immediately, but it means that the safety margin of the funds chasing the rise has decreased. The more common evolution path is: either the high-level sideways digestion will cause the RSI to become dull and fall back; or the pullback will first fall back to the key support level to complete the "pullback confirmation" and then choose a new direction. In summary, the current situation is more like a high-level consolidation phase after the upward trend. Traders should pay attention to the validity of the breakout at $94.099 and the defensive quality of the two support levels at $91 and $85.
Market Sentiment Observation
The key short-term sentiment terms are "defense and uncertainty premium." When tariff-related statements are inconsistent, with clear timings but uncertain conditions, the market typically prices in the tail-end scenario with a higher risk premium, thus benefiting precious metals. Meanwhile, silver exhibits greater sentiment elasticity: once signs of easing emerge, early buying and short-term leveraged funds are prone to concentrated profit-taking, leading to a rapid pullback; conversely, if statements continue to escalate, short covering and trend-following funds will push prices upward again.
Therefore, the market rhythm in the coming days may resemble "news-driven pulse fluctuations": positive news will push prices up, while a lack of new catalysts will lead to high-level consolidation, with data and news jointly determining the next breakout or pullback. For traders, in this environment, it is more important to identify "post-breakout support" and "post-pullback retests" rather than simply chasing the price fluctuations of a single candlestick.
- Risk Warning and Disclaimer
- The market involves risk, and trading may not be suitable for all investors. This article is for reference only and does not constitute personal investment advice, nor does it take into account certain users’ specific investment objectives, financial situation, or other needs. Any investment decisions made based on this information are at your own risk.