Why are gold and the US dollar experiencing such contrasting fortunes amidst the collapse of US and Japanese bond markets? Keep an eye on these two key turning points!
2026-01-20 19:29:41
On Tuesday (January 20), global financial markets experienced a severe shock triggered by the sovereign debt market. US President Trump's latest tariff rhetoric, coupled with concerns about fiscal discipline in Japan stemming from the snap election, created a "perfect storm" with global repercussions. Against this backdrop, a clear shift in market logic emerged: the traditional narrative of an "interest rate shock" temporarily receded, while a "safe-haven shock" driven by uncertainty surrounding sovereign credit and policy became the core driving force.
This is directly reflected in the interconnectedness of three key markets: US Treasuries experienced a broad sell-off, long-term yields soared, and the yield curve steepened sharply; the US dollar index came under downward pressure; while spot gold ignored the theoretical resistance from rising US Treasury yields, strongly breaking through historical highs, reaching $4731.34 per ounce during the session. Although the Japanese yen was directly impacted by the collapse of its domestic bond market, it showed some resilience against the US dollar amidst the complex interplay of global safe-haven flows, avoiding a one-sided plunge. This market characteristic clearly indicates that the primary concern is no longer simply the interest rate path, but rather higher-level political and fiscal risks.

Monday's sell-off in the Japanese government bond (JGB) market was nothing short of a "collapse." The yield on 30-year JGBs surged 35 basis points in a single day, while the yield on 40-year bonds jumped nearly 50 basis points, with some bond prices falling below 40% of face value. This was not a normal correction, but rather a severe reassessment of Japan's fiscal prospects. Following Prime Minister Sanae Takaichi's announcement of a snap election, both ruling and opposition parties pledged tax cuts and other fiscal spending, severely shaking market confidence in the sustainability of Japan's debt. The weak results of the 20-year JGB auction that day (the bid-to-cover ratio fell to 3.19, far below the previous 4.10) confirmed the depletion of demand.
Technical Analysis and Range Analysis <br/>The USD/JPY pair is currently trading around 157.80, having dipped slightly during the day. Looking at the 4-hour chart, the price has broken below the Bollinger Band middle line (158.13) and is testing support near the lower band (157.51). The MACD indicator is below the zero line, with both the DIFF and DEA lines negative and trending downwards, indicating that short-term downward momentum is still accumulating. The key watershed is located in the 157.50 area, which is not only where the lower Bollinger Band is located but also a previous important consolidation platform. A decisive break below this level could open up room for a slide towards the 156.80-157.00 range.
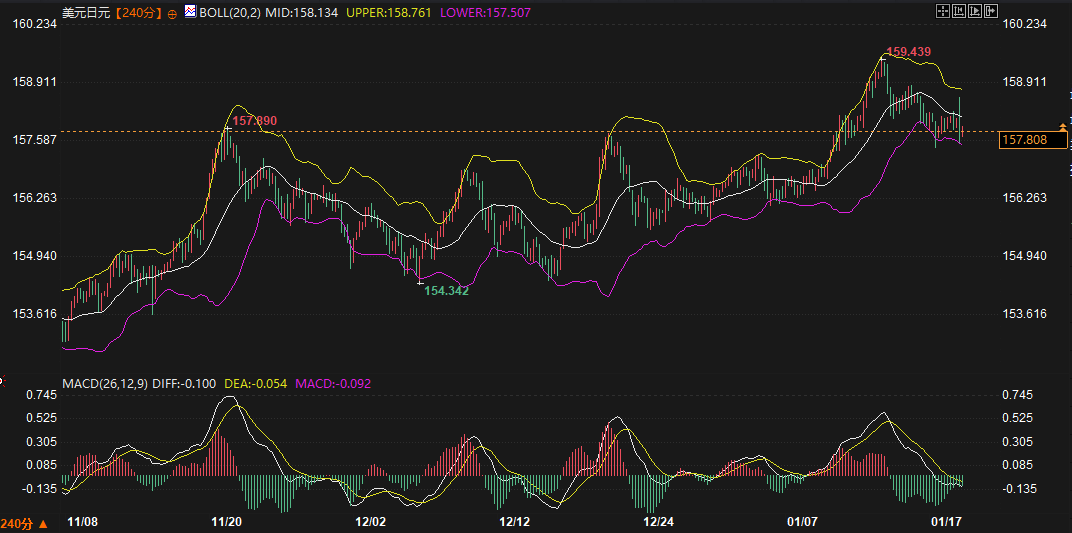
Outlook and Key Focus for the Next 2-3 Days <br />Short-term price movements depend entirely on the Bank of Japan's (BoJ) response. Market focus has shifted to its routine bond-buying operations. If the BoJ chooses to increase its bond purchases to appease the market, it may temporarily alleviate selling pressure on Japanese government bonds, but this would inject a large amount of yen liquidity into the market, potentially leading to a weaker yen (USD/JPY rebound). Conversely, if the BoJ shows any tolerance for soaring yields, it will be seen as tacit approval of a loss of fiscal discipline, potentially triggering a further crisis of confidence in Japanese government bonds among international investors, prompting safe-haven outflows and pushing up the yen (USD/JPY decline). Therefore, USD/JPY volatility will be exceptionally high in the coming trading days. Close attention should be paid to the BoJ's operational statements, any official verbal intervention, and changes in long-term Japanese government bond yields. Initial resistance is at 158.50 (near the previous support level and the Bollinger Middle Band), with stronger resistance at the psychological level of 159.00.
Unlike previous crisis patterns, the dollar did not strengthen due to market turmoil this time; instead, it was sold off along with US Treasury bonds. This anomaly highlights the root cause of the current risk: Trump's tariff rhetoric directly targets Europe, triggering deep market concerns about a deteriorating global trade environment and the unpredictability of US policy. An analyst from a well-known institution called this a "sell-on-America" trade, arguing that dollar depreciation itself has a similar effect to tariffs, benefiting US exports but harming trading partners. This has caused the dollar's inherent safe-haven properties to be overshadowed by its label as a "source of risk."
Technical Analysis and Range Logic <br/>The US Dollar Index is currently at 98.47, showing a significant intraday decline. On the 4-hour chart, the price has fallen below the lower Bollinger Band (98.60), and the Bollinger Bands are showing signs of widening, indicating that the downtrend may be accelerating. In the MACD indicator, both the DIFF and DEA lines are below the zero axis, and the DIFF line crossed below the DEA line to form a death cross and continued to decline, indicating strong bearish momentum. The key support level to watch is the 98.00-98.20 area, which was a densely traded area in the fourth quarter of last year. A break below this level could signify a longer-term erosion of market confidence in the US dollar.
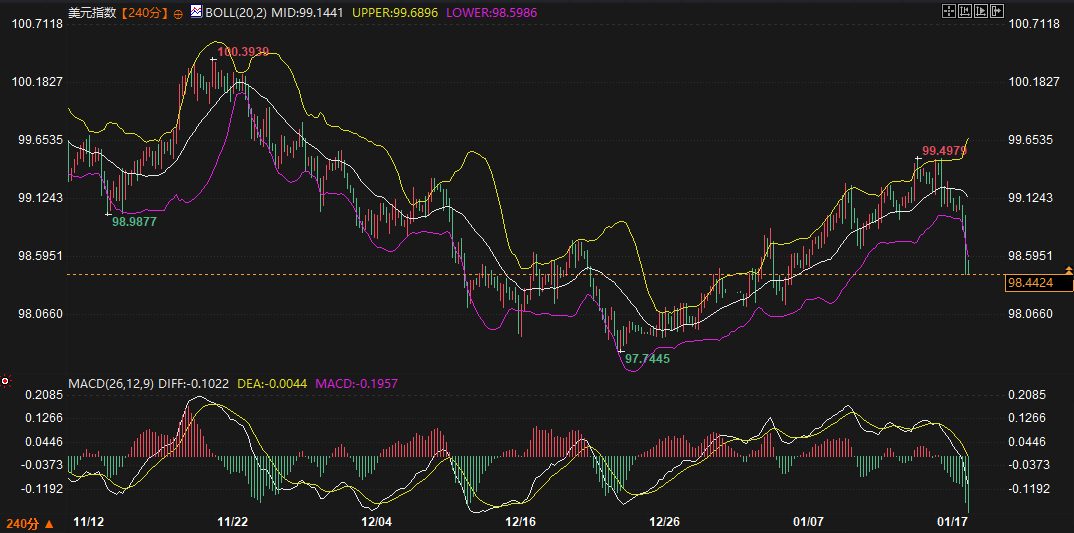
Outlook and Key Focus for the Next 2-3 Days : The short-term fate of the US dollar index is linked to two forces: the breadth of risk aversion and the trend of US Treasury yields. If market panic spreads further from the US and Japanese bond markets to other markets such as Europe, the relative disadvantage of the dollar may be partially offset. However, if long-term US yields continue to rise due to inflation or fiscal concerns, and the Fed's policy expectations do not simultaneously shift significantly towards a hawkish stance, then the combination of real interest rates and fiscal risks will continue to put pressure on the dollar. In the coming days, attention should be paid to any specific countermeasures from the EU regarding tariff statements, as well as the US Supreme Court hearing on whether the president can arbitrarily dismiss Fed governors (involving former governor Cook), the outcome of which could profoundly affect perceptions of the Fed's independence. Initial resistance is at the psychological level of 99.00, with stronger resistance near the Bollinger Band middle line at 99.15.
Gold's performance on Monday best encapsulates the current market sentiment. Amid the so-called "negative" environment of the US 30-year Treasury yield surging to 4.93% (a new high since last September), gold prices jumped over 1%, repeatedly breaking historical records. This completely shattered the simple correlation of "rising yields, falling gold." The driving forces are clear: UBS analyst Giovanni Stanovo points out that concerns about growth, tariff threats, and the Trump administration's desire for low interest rates have collectively propelled gold to new highs. Gold has risen over 70% since the start of Trump's second term, with geopolitical and policy instability being the core drivers.
Technical Analysis and Range Logic <br />Spot gold is currently trading around $4726, closely following the upper Bollinger Band on the 4-hour chart (4736.61), exhibiting a very strong one-sided upward trend. The Bollinger Bands have widened significantly upwards, and the MACD indicator, after forming a golden cross at a high level, continues to diverge upwards, with the DIFF value reaching as high as 33.80, indicating extremely strong bullish momentum and the market being in a typical trend acceleration phase. As prices continue to reach new highs, traditional resistance levels have become ineffective, and the market is in the process of "finding resistance." The most direct reference point at present is the extension of the upper Bollinger Band.
Outlook and Key Focus for the Next 2-3 Days <br />Gold has entered an "overbought" trend driven by sentiment and capital flows. The risk of a short-term pullback accumulates as the gains widen, but any pullback could be seen as a new entry opportunity until the core logic dominating the market changes. The key in the coming days is whether the market will continue to trade on the themes of "sovereign credit risk" and "de-dollarization," or refocus on the opportunity cost pressure of holding gold in a "high-interest-rate environment."
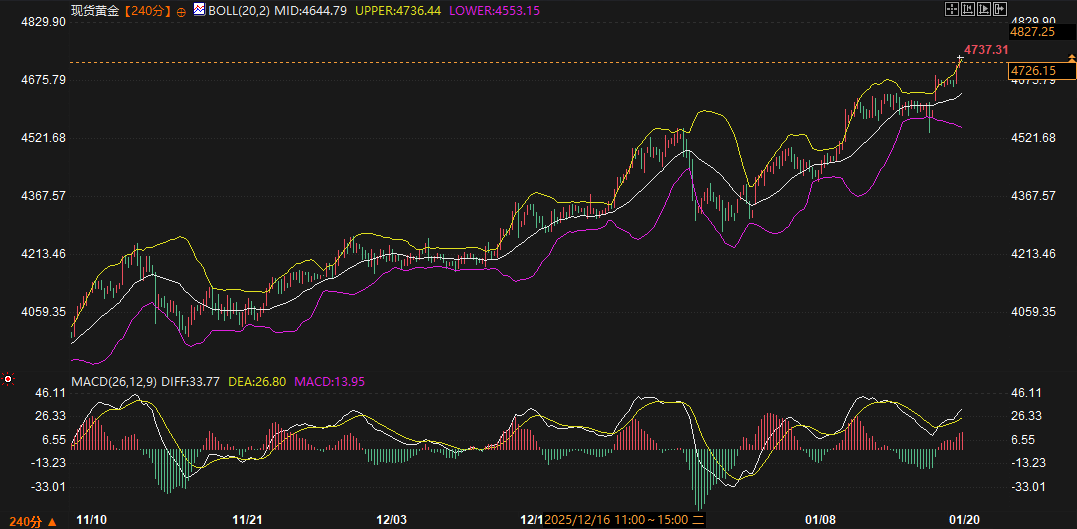
Two key signals need close monitoring during the trading session: First, whether gold prices and US Treasury yields continue to show a positive correlation (i.e., rising in tandem). If so, it proves that the safe-haven logic is completely dominant. Second, whether the negative correlation between gold prices and US stocks (especially the Nasdaq index, which represents risk appetite) continues. Additionally, attention should be paid to whether there are signs of large institutions taking profits. Initial support is at the $4700 level, with more significant support in the previous high of $4650-$4660, which is also a potential target after the 4-hour Bollinger Band middle line (4544.81) dynamically moves upward. There is no historical resistance above, and the next psychological target could be $4750 or even $4800.
In summary, the market will remain in the aftermath of the "perfect storm" that began earlier this week for the next 2-3 trading days. The yen's movement hinges on the Bank of Japan's decisions, the dollar's outlook is constrained by its own policy risks, while gold continues to play the role of the ultimate safe-haven asset. Closely monitor the movements of US and Japanese government bond yields, potential intervention signals from major central banks, and changes in sentiment in risk assets (equities) to determine how this storm triggered by the bond market will reshape the short-term landscape of the foreign exchange and precious metals markets.
This is directly reflected in the interconnectedness of three key markets: US Treasuries experienced a broad sell-off, long-term yields soared, and the yield curve steepened sharply; the US dollar index came under downward pressure; while spot gold ignored the theoretical resistance from rising US Treasury yields, strongly breaking through historical highs, reaching $4731.34 per ounce during the session. Although the Japanese yen was directly impacted by the collapse of its domestic bond market, it showed some resilience against the US dollar amidst the complex interplay of global safe-haven flows, avoiding a one-sided plunge. This market characteristic clearly indicates that the primary concern is no longer simply the interest rate path, but rather higher-level political and fiscal risks.
Japanese Yen (USD/JPY): The Game at the Center of the Domestic Storm
Monday's sell-off in the Japanese government bond (JGB) market was nothing short of a "collapse." The yield on 30-year JGBs surged 35 basis points in a single day, while the yield on 40-year bonds jumped nearly 50 basis points, with some bond prices falling below 40% of face value. This was not a normal correction, but rather a severe reassessment of Japan's fiscal prospects. Following Prime Minister Sanae Takaichi's announcement of a snap election, both ruling and opposition parties pledged tax cuts and other fiscal spending, severely shaking market confidence in the sustainability of Japan's debt. The weak results of the 20-year JGB auction that day (the bid-to-cover ratio fell to 3.19, far below the previous 4.10) confirmed the depletion of demand.
Technical Analysis and Range Analysis <br/>The USD/JPY pair is currently trading around 157.80, having dipped slightly during the day. Looking at the 4-hour chart, the price has broken below the Bollinger Band middle line (158.13) and is testing support near the lower band (157.51). The MACD indicator is below the zero line, with both the DIFF and DEA lines negative and trending downwards, indicating that short-term downward momentum is still accumulating. The key watershed is located in the 157.50 area, which is not only where the lower Bollinger Band is located but also a previous important consolidation platform. A decisive break below this level could open up room for a slide towards the 156.80-157.00 range.
Outlook and Key Focus for the Next 2-3 Days <br />Short-term price movements depend entirely on the Bank of Japan's (BoJ) response. Market focus has shifted to its routine bond-buying operations. If the BoJ chooses to increase its bond purchases to appease the market, it may temporarily alleviate selling pressure on Japanese government bonds, but this would inject a large amount of yen liquidity into the market, potentially leading to a weaker yen (USD/JPY rebound). Conversely, if the BoJ shows any tolerance for soaring yields, it will be seen as tacit approval of a loss of fiscal discipline, potentially triggering a further crisis of confidence in Japanese government bonds among international investors, prompting safe-haven outflows and pushing up the yen (USD/JPY decline). Therefore, USD/JPY volatility will be exceptionally high in the coming trading days. Close attention should be paid to the BoJ's operational statements, any official verbal intervention, and changes in long-term Japanese government bond yields. Initial resistance is at 158.50 (near the previous support level and the Bollinger Middle Band), with stronger resistance at the psychological level of 159.00.
The US Dollar Index: From a Safe-Haven Currency to a Source of Risk
Unlike previous crisis patterns, the dollar did not strengthen due to market turmoil this time; instead, it was sold off along with US Treasury bonds. This anomaly highlights the root cause of the current risk: Trump's tariff rhetoric directly targets Europe, triggering deep market concerns about a deteriorating global trade environment and the unpredictability of US policy. An analyst from a well-known institution called this a "sell-on-America" trade, arguing that dollar depreciation itself has a similar effect to tariffs, benefiting US exports but harming trading partners. This has caused the dollar's inherent safe-haven properties to be overshadowed by its label as a "source of risk."
Technical Analysis and Range Logic <br/>The US Dollar Index is currently at 98.47, showing a significant intraday decline. On the 4-hour chart, the price has fallen below the lower Bollinger Band (98.60), and the Bollinger Bands are showing signs of widening, indicating that the downtrend may be accelerating. In the MACD indicator, both the DIFF and DEA lines are below the zero axis, and the DIFF line crossed below the DEA line to form a death cross and continued to decline, indicating strong bearish momentum. The key support level to watch is the 98.00-98.20 area, which was a densely traded area in the fourth quarter of last year. A break below this level could signify a longer-term erosion of market confidence in the US dollar.
Outlook and Key Focus for the Next 2-3 Days : The short-term fate of the US dollar index is linked to two forces: the breadth of risk aversion and the trend of US Treasury yields. If market panic spreads further from the US and Japanese bond markets to other markets such as Europe, the relative disadvantage of the dollar may be partially offset. However, if long-term US yields continue to rise due to inflation or fiscal concerns, and the Fed's policy expectations do not simultaneously shift significantly towards a hawkish stance, then the combination of real interest rates and fiscal risks will continue to put pressure on the dollar. In the coming days, attention should be paid to any specific countermeasures from the EU regarding tariff statements, as well as the US Supreme Court hearing on whether the president can arbitrarily dismiss Fed governors (involving former governor Cook), the outcome of which could profoundly affect perceptions of the Fed's independence. Initial resistance is at the psychological level of 99.00, with stronger resistance near the Bollinger Band middle line at 99.15.
Spot Gold: Value Reassessment Amid Extreme Safe-Haven Sentiment
Gold's performance on Monday best encapsulates the current market sentiment. Amid the so-called "negative" environment of the US 30-year Treasury yield surging to 4.93% (a new high since last September), gold prices jumped over 1%, repeatedly breaking historical records. This completely shattered the simple correlation of "rising yields, falling gold." The driving forces are clear: UBS analyst Giovanni Stanovo points out that concerns about growth, tariff threats, and the Trump administration's desire for low interest rates have collectively propelled gold to new highs. Gold has risen over 70% since the start of Trump's second term, with geopolitical and policy instability being the core drivers.
Technical Analysis and Range Logic <br />Spot gold is currently trading around $4726, closely following the upper Bollinger Band on the 4-hour chart (4736.61), exhibiting a very strong one-sided upward trend. The Bollinger Bands have widened significantly upwards, and the MACD indicator, after forming a golden cross at a high level, continues to diverge upwards, with the DIFF value reaching as high as 33.80, indicating extremely strong bullish momentum and the market being in a typical trend acceleration phase. As prices continue to reach new highs, traditional resistance levels have become ineffective, and the market is in the process of "finding resistance." The most direct reference point at present is the extension of the upper Bollinger Band.
Outlook and Key Focus for the Next 2-3 Days <br />Gold has entered an "overbought" trend driven by sentiment and capital flows. The risk of a short-term pullback accumulates as the gains widen, but any pullback could be seen as a new entry opportunity until the core logic dominating the market changes. The key in the coming days is whether the market will continue to trade on the themes of "sovereign credit risk" and "de-dollarization," or refocus on the opportunity cost pressure of holding gold in a "high-interest-rate environment."
Two key signals need close monitoring during the trading session: First, whether gold prices and US Treasury yields continue to show a positive correlation (i.e., rising in tandem). If so, it proves that the safe-haven logic is completely dominant. Second, whether the negative correlation between gold prices and US stocks (especially the Nasdaq index, which represents risk appetite) continues. Additionally, attention should be paid to whether there are signs of large institutions taking profits. Initial support is at the $4700 level, with more significant support in the previous high of $4650-$4660, which is also a potential target after the 4-hour Bollinger Band middle line (4544.81) dynamically moves upward. There is no historical resistance above, and the next psychological target could be $4750 or even $4800.
In summary, the market will remain in the aftermath of the "perfect storm" that began earlier this week for the next 2-3 trading days. The yen's movement hinges on the Bank of Japan's decisions, the dollar's outlook is constrained by its own policy risks, while gold continues to play the role of the ultimate safe-haven asset. Closely monitor the movements of US and Japanese government bond yields, potential intervention signals from major central banks, and changes in sentiment in risk assets (equities) to determine how this storm triggered by the bond market will reshape the short-term landscape of the foreign exchange and precious metals markets.
- Risk Warning and Disclaimer
- The market involves risk, and trading may not be suitable for all investors. This article is for reference only and does not constitute personal investment advice, nor does it take into account certain users’ specific investment objectives, financial situation, or other needs. Any investment decisions made based on this information are at your own risk.